#1170 closed defect (fixed)
new-downloader performs badly when downloading a lot of data from a file
| Reported by: | zooko | Owned by: | |
|---|---|---|---|
| Priority: | critical | Milestone: | 1.8.0 |
| Component: | code-network | Version: | 1.8β |
| Keywords: | immutable download performance regression | Cc: | |
| Launchpad Bug: |
Description (last modified by terrell)
Some measurements:
| run..... | version | downloaded | download KBps | flags | |
|---|---|---|---|---|---|
| 101 | 1.8.0c2 | 100 MB | 91 | ||
| 102 | 1.7.1 | 100 MB | 182 | ||
| 103 | 1.7.1 | 100 MB | 207 | ||
| 104 | 1.8.0c2 | 100 MB | 82 | ||
| 105 | 1.7.1 | 100 MB | 211 | ||
| 109 | 1.7.1 | 100 MB | 228 | cProfile | |
| 110 | 1.8.0c2 | 100 MB | 113 | cProfile | |
| 111 | 1.8.0c2 | 413 MB | 19 | spanstrace | |
| 112 | 1.8.0c2 | 456 MB | 113 | spanstrace, spans.py.diff | |
| 113 | 1.7.1 | 543 MB | 241 | on office network | |
| 114 | 1.8.0c2 | 456 MB | 147 | spans.py.diff + comment:54 | |
| 115 | 1.7.1 | 456 MB | 224 | flog | |
| 116 | 1.8.0c2 | 314 MB | 154 | spans.py.diff + comment:54 , used 3*nszi | flog |
| 117 | 1.8.0c2 | 36 MB | 160 | cProfile spans.py.diff + comment:54 | prof |
| 118 | 1.8.0c2 | 1490 MB | 158 | cProfile spans.py.diff + comment:54 | prof |
| 119 | 1.7.1 | 543 MB | 99 | on office network, noflog | |
| 120 | 1.8.0c2 | 543 MB | 319 | on office network, noflog, spans.py.diff + comment:54 | |
| 121 | 1.7.1 | 543 MB | 252 | on office network, noflog | |
| 122 | 1.8.0c2 | 1490 MB | 157 | noflog, spans.py.diff + comment:54, nologging in immutable/download/share.py | |
| 123 | 1.8.0c2 | 100 MB | 242 | noflog, spans.py.diff + comment:54, nologging in immutable/download/*.py | status.html |
| 124 | 1.7.1 | 100 MB | 219 | noflog | |
| 125 | 1.8.0c2 | 100 MB | 161 | noflog, spans.py.diff + comment:54, nologging in immutable/download/*.py | |
| 126 | 1.7.1 | 100 MB | 223 | noflog | |
| 127 | 1.8.0c2 | 100 MB | 155 | noflog, spans.py.diff + comment:54, nologging in immutable/download/*.py | status.html |
| 129 | 1.8.0c2 | 100 MB | 291 | on office network, noflog, 1170-combo.diff | |
| 130 | 1.8.0c2 | 100 MB | 179 | on office network, noflog, 1170-combo.diff | |
| 131 | 1.8.0c2 | 100 MB | 276 | on office network, noflog, 1170-combo.diff | |
| 132 | 1.8.0c2 | 100 MB | 179 | on office network, noflog, 1170-combo.diff | |
| 133 | 1.8.0c2 | 100 MB | 279 | on office network, noflog, 1170-combo.diff | |
| 134 | 1.8.0c2 | 100 MB | 262 | on office network, noflog, 1170-combo.diff | |
| 135 | 1.8.0c2 | 100 MB | 180 | on office network, noflog, 1170-combo.diff | |
| 136 | 1.8.0c2 | 100 MB | 284 | on office network, noflog, 1170-combo.diff | |
| 137 | 1.8.0c2 | 100 MB | 286 | on office network, noflog, 1170-combo.diff | |
| 138 | 1.7.1 | 867 MB | 265 | on office network, noflog | |
| 139 | 1.8.0c2 | 866 MB | 169 | on office network, noflog, 1170-combo.diff used 1*sp26,1*nszi,1*fp3x | status.html |
| 140 | 1.7.1 | 100 MB | 169 | terrell, home cable modem | |
| 141 | 1.8.0c2 | 100 MB | 223 | terrell, home cable modem, 1170-combo.diff used 1*sp26,1*nszi,1*4rk5 | status.html |
| 142 | 1.8.0c2 | 100 MB | 215 | terrell, home cable modem, 1170-combo.diff | status.html |
| 143 | 1.8.0c2 | 100 MB | 235 | terrell, home cable modem, 1170-combo.diff | status.html |
| 144 | 1.7.1 | 100 MB | 159 | terrell, home cable modem | |
| 145 | 1.8.0c2 | 100 MB | 131 | terrell, home cable modem, 1170-combo.diff used 1*sp26,1*nszi,1*fp3x | status.html |
| 146 | 1.7.1 | 100 MB | 184 | terrell, home cable modem | |
| 147 | 1.8.0c2 | 100 MB | 233 | terrell, home cable modem, 1170-combo.diff used 1*sp26,1*nszi,1*4rk5 | status.html |
| 148 | 1.7.1 | 100 MB | 172 | terrell, home cable modem | |
| 149 | 1.8.0c2 | 100 MB | 259 | terrell, home cable modem, 1170-combo.diff used 1*sp26,1*nszi,1*4rk5 | status.html |
| 150 | 1.7.1 | 100 MB | 141 | terrell, home cable modem | |
| 151 | 1.8.0c2 | 100 MB | 139 | terrell, home cable modem, 1170-combo.diff used 1*sp26,1*nszi,1*sroo | status.html |
| 152 | 1.7.1 | 100 MB | 159 | terrell, home cable modem | |
| 153 | 1.8.0c2 | 100 MB | 241 | terrell, home cable modem, 1170-combo.diff used 1*sp26,1*nszi,1*4rk5 | status.html |
| 154 | 1.7.1 | 100 MB | 172 | terrell, home cable modem | |
| 155 | 1.8.0c2 | 100 MB | 229 | terrell, home cable modem, 1170-combo.diff used 1*sp26,1*nszi,1*4rk5 | status.html |
| 156 | 1.7.1 | 100 MB | 159 | terrell, home cable modem | |
| 157 | 1.8.0c2 | 100 MB | 174 | terrell, home cable modem, 1170-combo.diff used 1*nszi,1*4rk5,1*fp3x | status.html |
| 158 | 1.7.1 | 100 MB | 173 | terrell, home cable modem | |
| 159 | 1.8.0c2 | 100 MB | 262 | terrell, home cable modem, 1170-combo.diff | status.html |
| 160 | 1.7.1 | 100 MB | 152 | terrell, home cable modem | |
| 161 | 1.8.0c2 | 100 MB | 248 | terrell, home cable modem, 1170-combo.diff | status.html |
| 162 | 1.7.1 | 100 MB | 135 | terrell, home cable modem | |
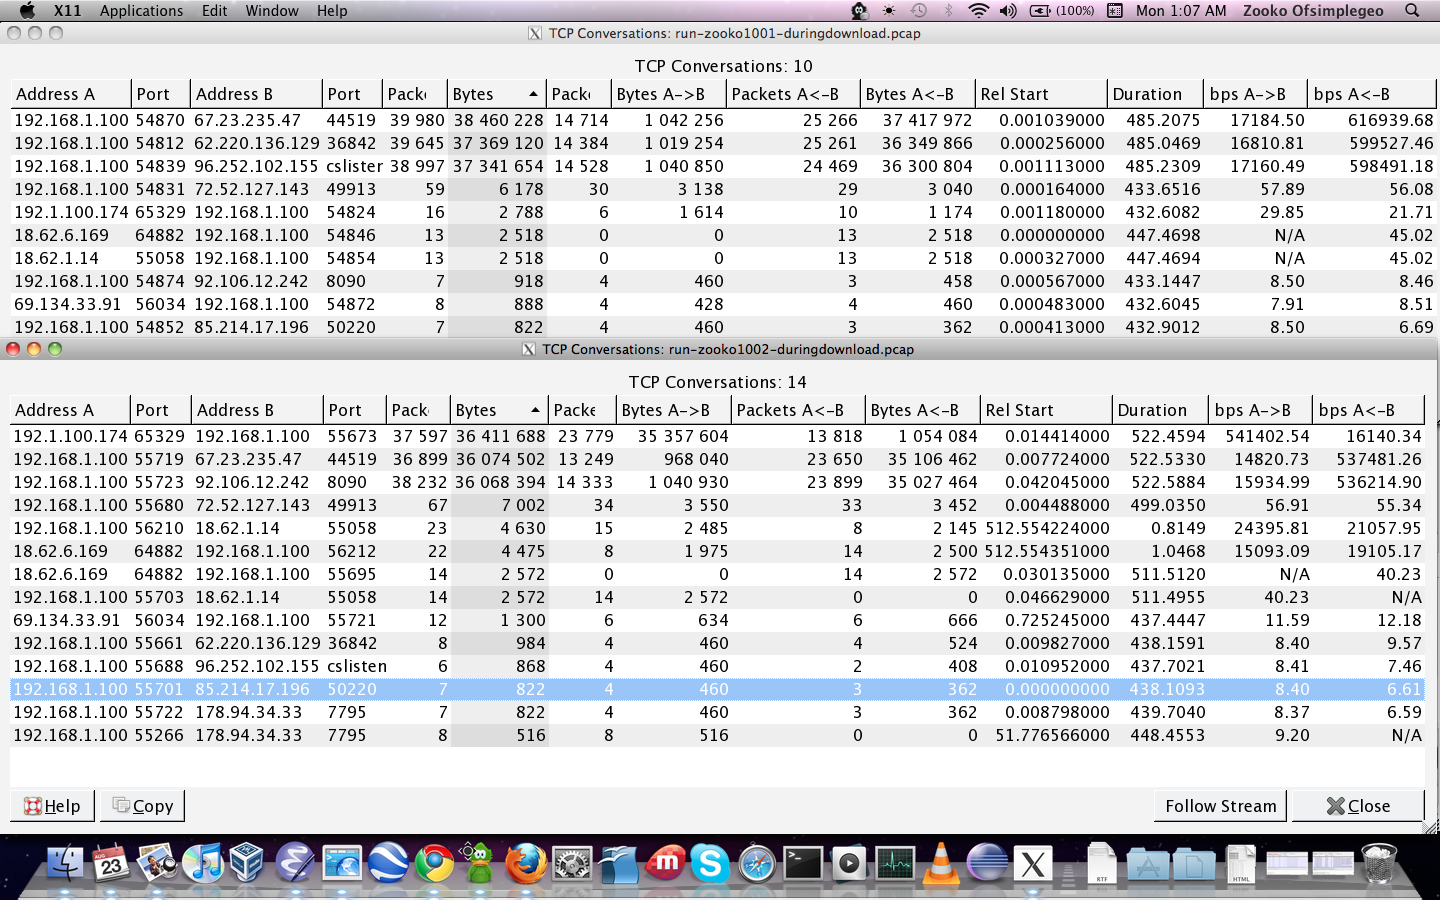
| 1001 | 1.7.1 | 100 MB | 201 | used 1*sp26,1*sroo,1*4rk5 | flog pcap wireshark |
| 1002 | 1.8.0c2 | 100 MB | 186 | 1170-combo.diff used 3*nsziz,1*sp26,1*fp3x | flog pcap status.html wireshark |
| 2000 | 1.7.1 | 100 MB | 187 | used 1*sp26,1*sroo,1*4rk5 | twistd.log |
| 2001 | 1.8.0c2 | 100 MB | 172 | 1170-combo.diff used 2*sp26,2*fp3x,1*4rk5 | status.html |
| 2002 | 1.7.1 | 100 MB | 220 | used 1*sp26,1*sroo,1*4rk5 | twistd.log |
| 2003 | 1.8.0c2 | 100 MB | 214 | 1170-combo.diff used 2*sp26,2*nszi,1*4rk5 | status.html |
| 2004 | 1.7.1 | 100 MB | 188 | used 1*sp26,1*sroo,1*4rk5 | twistd.log |
| 2005 | 1.8.0c2 | 100 MB | 164 | 1170-combo.diff used 2*sp26,2*nszi,1*fp3x | status.html |
| 2006 | 1.7.1 | 100 MB | 193 | used 1*sp26,1*sroo,1*4rk5 | twistd.log |
| 2007 | 1.8.0c2 | 100 MB | 163 | 1170-combo.diff used 2*sp26,2*nszi,1*fp3x | status.html |
| 2008 | 1.7.1 | 100 MB | 188 | used 1*sp26,1*sroo,1*4rk5 | twistd.log |
| 2009 | 1.8.0c2 | 100 MB | 167 | 1170-combo.diff used 2*sp26,2*nszi,1*fp3x | status.html |
| 2010 | 1.7.1 | 100 MB | 222 | used 1*sp26,1*sroo,1*4rk5 | twistd.log |
| 2011 | 1.8.0c2 | 100 MB | 171 | 1170-combo.diff used 2*sp26,2*nszi,1*fp3x | status.html |
| 2012 | 1.7.1 | 100 MB | 208 | used 1*sp26,1*sroo,1*4rk5 | twistd.log |
| 2013 | 1.8.0c2 | 100 MB | 171 | 1170-combo.diff used 2*sp26,2*nszi,1*fp3x | status.html |
| 2014 | 1.7.1 | 100 MB | 216 | used 1*sp26,1*sroo,1*4rk5 | twistd.log |
| 2015 | 1.8.0c2 | 100 MB | 174 | 1170-combo.diff used 2*sp26,2*nszi,1*fp3x | status.html |
| 2016 | 1.7.1 | 100 MB | 212 | used 1*sp26,1*sroo,1*4rk5 | twistd.log |
| 2017 | 1.8.0c2 | 100 MB | 172 | 1170-combo.diff used 2*sp26,2*nszi,1*fp3x | status.html |
| 2018 | 1.7.1 | 100 MB | 204 | used 1*sp26,1*sroo,1*4rk5 | twistd.log |
| 2019 | 1.8.0c2 | 100 MB | 222 | 1170-combo.diff used 2*sp26,2*nszi,1*4rk5 | status.html |
| 3000 | 1.7.1 | 333 MB | 164 | negativland.ogg used 2*fp3x,1*tavr | twistd.log |
| 3001 | 1.8.0c2 | 333 MB | 91 | negativland.ogg used 2*fp3x,2(1)*tavr | status.html |
| 3002 | 1.7.1 | 224 MB | 28 | negativland.ogg used 2*fp3x,1*tavr | twistd.log |
| 3100 | 1.7.1 | 333 MB | 90 | terrell, home cable modem, negativland.ogg used 2*fp3x,1*tavr | status.html |
| 3101 | 1.8.0c2 | 0 MB | n/a | terrell, home cable modem, negativland.ogg | download attempt failed immediately |
| 3102 | 1.7.1 | 0 MB | n/a | terrell, home cable modem, negativland.ogg | download attempt failed immediately |
| 3103 | 1.8.0c2 | 0 MB | n/a | terrell, home cable modem, negativland.ogg | download attempt failed immediately |
| 3104 | 1.7.1 | 333 MB | 92 | terrell, home cable modem, negativland.ogg used 2*fp3x,1*tavr | status.html |
| 3105 | 1.8.0c2 | 333 MB | 95 | terrell, home cable modem, negativland.ogg used 2*fp3x,1*tavr | status.html |
| 3106 | 1.7.1 | 333 MB | 93 | terrell, home cable modem, negativland.ogg used 2*fp3x,1*tavr | status.html |
| 3107 | 1.8.0c2 | 333 MB | 93 | terrell, home cable modem, negativland.ogg used 2*fp3x,1*tavr | status.html |
| 3108 | 1.7.1 | 333 MB | 92 | terrell, home cable modem, negativland.ogg used 2*fp3x,1*tavr | status.html |
| 3109 | 1.8.0c2 | 333 MB | 91 | terrell, home cable modem, negativland.ogg used 2*fp3x,1*tavr | status.html |
| 4000 | 1.7.1 | 333 MB | 93 | on office network, negativland.ogg used 2*fp3x,1*tavr | serverselection-twistd.log twistd.log.tar.bz2 |
| 4001 | 1.8.0c2 | 333 MB | 94 | on office network, negativland.ogg used 2*fp3x,1*tavr | status.html |
| 4002 | 1.7.1 | 333 MB | 193 | on office network, negativland.ogg used 1*fp3x,2*tavr | serverselection-twistd.log twistd.log.tar.bz2 |
| 4003 | 1.8.0c2 | 333 MB | 94 | on office network, negativland.ogg used 2*fp3x,1*tavr | status.html |
| 4004 | 1.7.1 | 333 MB | 189 | on office network, negativland.ogg used 1*fp3x,2*tavr | serverselection-twistd.log twistd.log.tar.bz2 |
| 4005 | 1.8.0c2 | 333 MB | 93 | on office network, negativland.ogg used 2*fp3x,1*tavr | status.html |
| 4006 | 1.7.1 | 333 MB | 189 | on office network, negativland.ogg used 1*fp3x,2*tavr | serverselection-twistd.log twistd.log.tar.bz2 |
Attachments (106)
Change History (222)
comment:1 Changed at 2010-08-12T16:28:41Z by zooko
comment:2 follow-ups: ↓ 3 ↓ 4 ↓ 11 Changed at 2010-08-12T18:15:54Z by warner
yeah, the 32/64-byte reads are hashtree nodes. The spans structure only coaleses adjacent/overlapping reads (the 64-byte reads are the result of two neighboring 32-byte hashtree nodes being fetched), but all requests are pipelined (note the "txtime" column in the "Requests" table, which tracks remote-bucket-read requests), and the overhead of each message is fairly small (also note the close proximity of the "rxtime" for those batches of requests). So I'm not particularly worried about merging these requests further.
My longer-term goal is to extend the Spans data structure with some sort of "close enough" merging feature: given a Spans bitmap, return a new bitmap with all the small holes filled in, so e.g. a 32-byte gap between two hashtree nodes (which might not be strictly needed until a later segment is read) would be retrieved early. The max-hole-size would need to be tuned to match the overhead of each remote-read message (probably on the order of 30-40 bytes): there's a breakeven point somewhere in there.
Another longer-term goal is to add a readv()-type API to the remote share-read protocol, so we could fetch multiple ranges in a single call. This doesn't shave much overhead off of just doing multiple pipelined read() requests, so again it's low-priority.
And yes, a cleverer which-share-should-I-use-now algorithm might reduce stalls like that. I'm working on visualization tools to show the raw download-status events in a Gantt-chart -like form, which should make it easier to develop such an algorithm. For now, you want to look at the Request table for correlations between reads that occur at the same time. For example, at the +1.65s point, I see several requests that take 1.81s/2.16s/2.37s . One clear improvement would be to fetch shares 0 and 5 from different servers: whatever slowed down the reads of sh0 also slowed down sh5. But note that sh8 (from the other server) took even longer: this suggests that the congestion was on your end of the line, not theirs, especially since the next segment arrived in less than half a second.
comment:3 in reply to: ↑ 2 Changed at 2010-08-12T18:38:22Z by zooko
Replying to warner:
yeah, the 32/64-byte reads are hashtree nodes. The spans structure only coaleses adjacent/overlapping reads (the 64-byte reads are the result of two neighboring 32-byte hashtree nodes being fetched), but all requests are pipelined (note the "txtime" column in the "Requests" table, which tracks remote-bucket-read requests), and the overhead of each message is fairly small (also note the close proximity of the "rxtime" for those batches of requests).
I don't understand what those columns mean (see #1169 (documentation for the new download status page)).
comment:4 in reply to: ↑ 2 Changed at 2010-08-12T19:12:36Z by zooko
Replying to warner:
For now, you want to look at the Request table for correlations between reads that occur at the same time.
I'm having trouble interpreting it (re: #1169).
For example, at the +1.65s point, I see several requests that take 1.81s/2.16s/2.37s . One clear improvement would be to fetch shares 0 and 5 from different servers: whatever slowed down the reads of sh0 also slowed down sh5. But note that sh8 (from the other server) took even longer: this suggests that the congestion was on your end of the line, not theirs, especially since the next segment arrived in less than half a second.
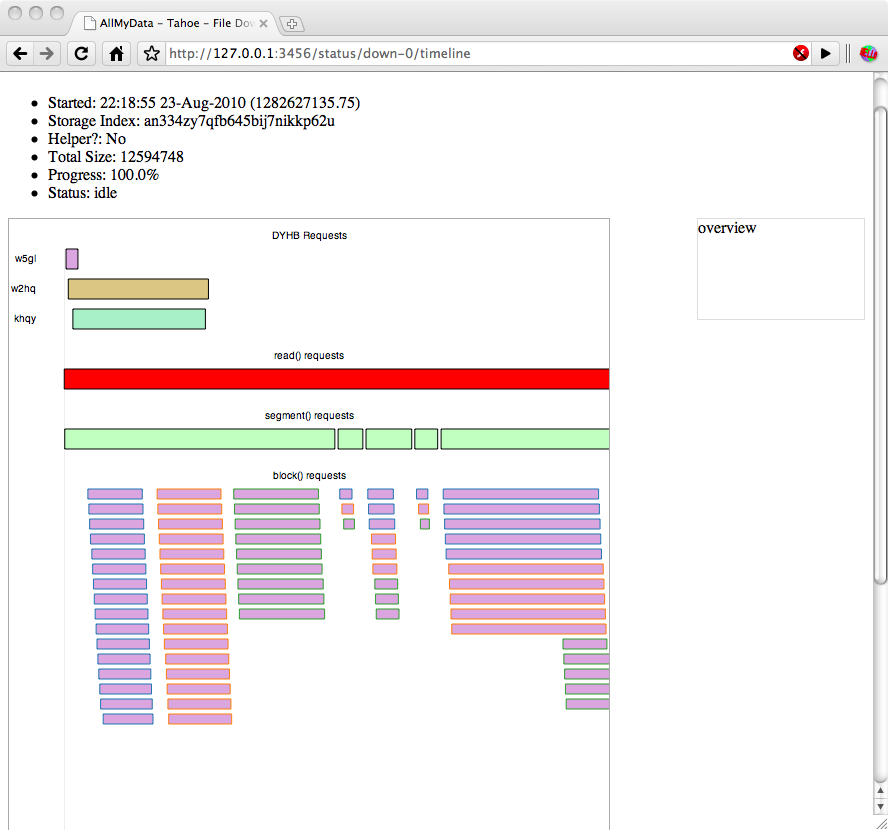
I tried to watch the same movie from my office network and got similarly unwatchable results, download status page attached. Could it be a problem with the way my client, VLC.app, is reading?
Changed at 2010-08-12T19:13:18Z by zooko
Changed at 2010-08-12T21:04:16Z by zooko
comment:5 Changed at 2010-08-12T21:04:27Z by zooko
Well, it wasn't the VLC.app client. I did another download of the same file using wget. The performance was bad--38 KB/s:
p$ wget http://localhost:3456/file/URI%3ACHK%3A4klgnafrwsm2nx3bqy24ygac5a%3Acrz7nhthi4bevzrug6xwgif2vhiacp7wk2cfmjutoz2ns3w45qza%3A3%3A10%3A1490710513/@@named=/bbb-360p24.i420.lossless.drc.ogg.fixed.ogg%2Bbbb-24fps.flac.via-ffmpeg.ogg
--2010-08-12 12:54:47--  http://localhost:3456/file/URI%3ACHK%3A4klgnafrwsm2nx3bqy24ygac5a%3Acrz7nhthi4bevzrug6xwgif2vhiacp7wk2cfmjutoz2ns3w45qza%3A3%3A10%3A1490710513/@@named=/bbb-360p24.i420.lossless.drc.ogg.fixed.ogg%2Bbbb-24fps.flac.via-ffmpeg.ogg
Resolving localhost... ::1, fe80::1, 127.0.0.1
Connecting to localhost|::1|:3456... failed: Connection refused.
Connecting to localhost|fe80::1|:3456... failed: Connection refused.
Connecting to localhost|127.0.0.1|:3456... connected.
HTTP request sent, awaiting response... 200 OK
Length: 1490710513 (1.4G) [application/ogg]
Saving to: `bbb-360p24.i420.lossless.drc.ogg.fixed.ogg+bbb-24fps.flac.via-ffmpeg.ogg'

16% [=========================>                                                                                                                                       ] 247,203,678 38.0K/s  eta 8h 0m   ^C
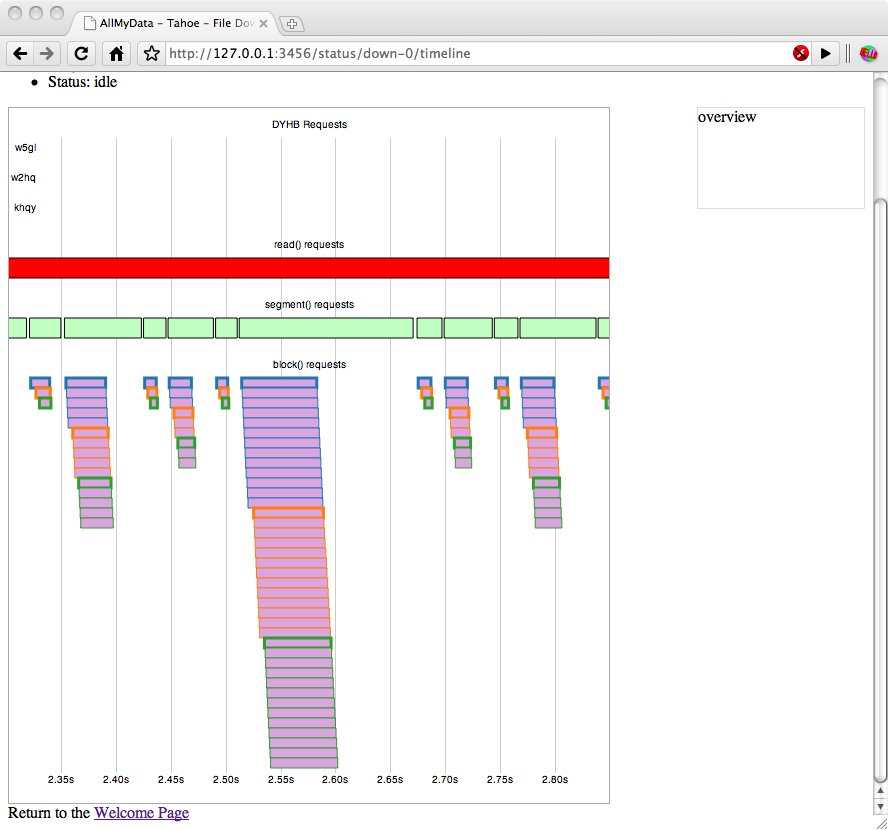
Here is the download status page for this download (attached). Note that one server had a DYHB RTT of 3 minutes and another had a DYHB RTT of 8 minutes! There were no incident report files or twistd.log entries.
comment:6 Changed at 2010-08-12T21:10:31Z by zooko
The two servers with dramatically higher DYHB RTTs introduced themselves as:
Service Name
Nickname
PeerID
Connected? 	Since 	First Announced
Version
storage
linuxpal
rpiw4n3ffzygwyzlkjb55upikk6mewtv
Yes: to 18.62.1.14:55058 	13:57:08 12-Aug-2010 	21:26:57 11-Aug-2010
allmydata-tahoe/1.7.1
and
storage
sunpal7
62nlabgfiuzbfseufd2yoymbjzsenbuz
Yes: to 18.62.6.169:64882 	14:25:33 12-Aug-2010 	21:26:57 11-Aug-2010
allmydata-tahoe/1.7.1
I pinged their IP addresses:
--- 18.62.6.169 ping statistics ---
21 packets transmitted, 21 packets received, 0.0% packet loss
round-trip min/avg/max/stddev = 74.049/78.417/91.016/3.839 ms
--- 18.62.1.14 ping statistics ---
21 packets transmitted, 21 packets received, 0.0% packet loss
round-trip min/avg/max/stddev = 73.153/78.478/92.159/4.260 ms
Changed at 2010-08-12T21:33:50Z by zooko
comment:7 Changed at 2010-08-12T21:34:16Z by zooko
- Keywords regression performance added
- Priority changed from major to critical
Okay, I've finally realized that this is a regression of the feature that we added in v1.6.0 to start fetching blocks as soon as you've learned about enough shares and to use the lowest-latency servers. Attached is the download status page from v1.7.1 of trying to download this same file from the same test grid. It performs much better:
$ wget http://localhost:3456/file/URI%3ACHK%3A4klgnafrwsm2nx3bqy24ygac5a%3Acrz7nhthi4bevzrug6xwgif2vhiacp7wk2cfmjutoz2ns3w45qza%3A3%3A10%3A1490710513/@@named=/bbb-360p24.i420.lossless.drc.ogg.fixed.ogg%2Bbbb-24fps.flac.via-ffmpeg.ogg
--2010-08-12 15:06:55--  http://localhost:3456/file/URI%3ACHK%3A4klgnafrwsm2nx3bqy24ygac5a%3Acrz7nhthi4bevzrug6xwgif2vhiacp7wk2cfmjutoz2ns3w45qza%3A3%3A10%3A1490710513/@@named=/bbb-360p24.i420.lossless.drc.ogg.fixed.ogg%2Bbbb-24fps.flac.via-ffmpeg.ogg
Resolving localhost... ::1, fe80::1, 127.0.0.1
Connecting to localhost|::1|:3456... failed: Connection refused.
Connecting to localhost|fe80::1|:3456... failed: Connection refused.
Connecting to localhost|127.0.0.1|:3456... connected.
HTTP request sent, awaiting response... 200 OK
Length: 1490710513 (1.4G) [application/ogg]
Saving to: `bbb-360p24.i420.lossless.drc.ogg.fixed.ogg+bbb-24fps.flac.via-ffmpeg.ogg.1'

 1% [=>                                                                                                                                                               ] 25,182,400   260K/s  eta 1h 43m  ^C
We can't release Tahoe-LAFS v1.8.0 with this behavior because it is a significant regression: people who use grids with slow or occasionally slow servers such as the public Test Grid would be ill-advised to upgrade from v1.7.1 to v1.8.0 and we don't like to release new versions that some users are ill-advised to upgrade to.
comment:8 Changed at 2010-08-12T21:46:52Z by zooko
I've noticed that when tickets get more than one attachment it becomes confusing for the reader to understand what is what, so here's a quick recap:
- http://tahoe-lafs.org/trac/tahoe-lafs/attachment/ticket/1169/down-0.html ; attached to #1169, download using 1.8.0c2 with VLC.app from my home (initial ticket)
- attachment:down-1.html ; download using 1.8.0c2 with VLC.app from my office (comment:4)
- attachment:down-2.html ; download using 1.8.0c2 with wget from my office (comment:5)
- attachment:down-0.html ; download using 1.7.1 with wget from my office (comment:7)
comment:9 Changed at 2010-08-12T21:53:39Z by zooko
The feature that we released in v1.6.0 was ticket #928, and we did add some sort of unit tests for it, by making some servers not respond to DYHB at all: http://tahoe-lafs.org/trac/tahoe-lafs/browser/trunk/src/allmydata/test/test_hung_server.py?rev=37a242e01af6cf76
(In the pre-1.6.0 version, that situation would cause download to stall indefinitely, so that was our primary goal at that time and that is what the tests ensure no longer happens.)
comment:10 Changed at 2010-08-12T21:54:35Z by zooko
Note: the wget speed indicator is telling about "current" speed and so it varies a lot during a download. To get reliable speed measurements I guess I should let the wget finish which means, I suppose, I should download a smaller file! I would use the download status pages timings as an indicator of performance instead of the wget speed indicator.
comment:11 in reply to: ↑ 2 Changed at 2010-08-12T22:10:16Z by davidsarah
Replying to warner:
One clear improvement would be to fetch shares 0 and 5 from different servers: whatever slowed down the reads of sh0 also slowed down sh5.
Yes, I was going to point that out. Given that the DYHB responses were:
serverid   sent         received     shnums   RTT
lv3fqmev   +0.001393s   +0.105560s            104ms
tavrk54e   +0.003111s   +0.211572s            208ms
xflgj7cg   +0.004095s   +0.111008s            107ms
sp26qyqc   +0.006173s   +0.117722s   0,5      112ms
sroojqcx   +0.007326s   +0.297761s   1,6      290ms
4rk5oqd7   +0.008324s   +0.212271s   2        204ms
nszizgf5   +0.009295s   +0.204480s   3,7,8    195ms
62nlabgf   +0.010490s   +0.203262s            193ms
fp3xjndg   +0.011982s   +0.242262s   4,9      230ms
rpiw4n3f   +0.013246s   +0.113830s            101ms
- Should the downloader have chosen to get shares from sp26qyqc, nszizgf5 and 4rk5oqd7, rather than getting two shares from sp26qyqc and one from nszizgf5?
- The file has a happiness of 5. Shouldn't the uploader have distributed the shares more evenly?
comment:12 Changed at 2010-08-12T22:32:06Z by warner
Yeah, I'd like to see some more quantifiable data. It's a pity that the old-downloader doesn't provide as much information as the new one (a flog might help), but obviously I learned from experience with old-downloader while building the instrumentation on the new-downloader :).
The status data you show from both downloaders show a server in common, and the other server responded to the DYHB very quickly, so for at least the beginning of the download, I don't think the downloader has enough information to do any better.
Many of the new-downloader block-requests (I'm looking at the +179s to +181s mark) show correlated stalls of both the "fast" server (sp26) and the other "slow" server (nszi). If the problem were a single slow server, I'd expect to see big differences between the response times.
Interesting. So, the main known-problem with the new-downloader (at least the one on the top of my personal list) is its willingness to pull multiple shares from the same server (a "diversity failure"), which obviously has the potential to be slower than getting each share from a different server.
This is plausibly acceptable for the first segment, because the moment we receive the DYHB response that takes us above "k" shares, we're faced with a choice: start downloading now, or wait a while (how long??) in the hopes that new responses will increase diversity and result in a faster download.
But after the first segment, specifically after we've received the other DYHB responses, the downloader really ought to get as much diversity as it can, so pulling multiple shares from the same server (when there's an alternative) isn't excusable after that point.
The fix for this is to implement the next stage of the new-downloader project, which is to rank servers (and which-share-from-which-server mappings) according so some criteria (possibly speed, possibly cost, fairness, etc), and reevaluate that list after each segment is fetched. This is closely tied into the "OVERDUE" work, which is tied into the notion of cross-file longer-term server quality/reputation tracking, which is loosely tied into the notion of alternative backend server classes.
And I can't get that stage finished and tested in the next week, nor is a change that big a very stable thing to land this close to a release. So I'm hoping that further investigation will reveal something convenient, like maybe that 1.7.1 is actually just as variable as new-downloader on this grid, or that the two-shares-from-one-server problem isn't as bad as it first appears.
I *do* have a quick-and-dirty patch that might improve matters, which is worth experimenting with. I'll have to dig it out of a dark corner of my laptop, but IIRC it added an artificial half-second delay after receiving >=k shares from fewer than k servers. If new shares were found before that timer expired, the download would proceed with good diversity. If not, the download would begin with bad diversity after a small delay.
It fixed the basic problem, but I don't like arbitrary delays, and didn't address the deeper issue (you could still wind up pulling shares from slow servers even after you have evidence that there are faster ones available), so I didn't include it in #798.
comment:13 Changed at 2010-08-12T22:50:46Z by warner
RE davidsarah's comment:
Yeah, that's the sort of heuristic that I didn't want to guess at. It'll be easier to see this stuff when I land the visualization code. The arrival order of positive responses is:
- sp26 +117ms (sh0+sh5)
- nszi +204ms (sh3+sh7+sh8)
- 4rk5 +212ms (sh2)
- fp3x +242ms (sh4+sh9)
- sroo +298ms (sh1+sh6)
At +117ms, we don't have enough shares to download. At +204ms, we have enough shares but we'd like more diversity: we can't know that we could achieve our ideal diversity by waiting another 8 milliseconds, so we start downloading the first segment immediately.
By the time the second segment is started (at +977ms), we have a clearer picture of the available shares. We also have about 40kB of experience with each server (or 80kB for sp26, since we happened to fetch two shares from it), which we might use to make some guesses about speeds. When the second segment is started, at the very least we should prefer an arragement that gives us one share from each server. We might also like to prefer shares that we've already been using (since we'll have to fetch fewer hash-tree nodes to validate them); note that these two goals are already in conflict. We should prefer servers which gave us faster responses, if we believe that they're more likely to give fast responses in the future. But if we only hit up the really fast servers, they'll be using more bandwidth, which might cost them money, so they might prefer that we spread some of the load onto the slower servers, whatever we mutually think is fair.
And we need serendipity too: we should occasionally download a share from a random server, because it might be faster than any of the ones we're currently using, although maybe it won't be, so a random server may slow us down. All five of these goals conflict with each other, so there are weights and heuristics involved, which will change over time.
And we should remember some of this information beyond the end of a single download, rather than starting with an open mind each time, to improve overall efficiency.
So yeah, it's a small thread that, when tugged, pulls a giant elephant into the room. "No no, don't tug on that, you never know what it might be attached to".
So I'm hoping to find a quicker smaller solution for the short term.
comment:14 Changed at 2010-08-13T05:45:37Z by zooko
Brian asked for better measurements, and I ran quite a few (appended below). I think these results are of little use as they are very noisy and as far as I can tell I was just wrong when I thought, earlier today, that 1.8.0c2 was downloading this file slower than 1.7.1 did.
On the other hand I think these numbers are trying to tell us that something is wrong. Why does it occasionally take 40s to download 100K?
After I post this comment I will attach some status reports and flogs.
With v1.7.1 and no flogtool tail:
$ time curl --range 0-100000 http://localhost:3456/file/URI%3ACHK%3A4klgnafrwsm2nx3bqy24ygac5a%3Acrz7nhthi4bevzrug6xwgif2vhiacp7wk2cfmjutoz2ns3w45qza%3A3%3A10%3A1490710513/@@named=/bbb-360p24.i420.lossless.drc.ogg.fixed.ogg%2Bbbb-24fps.flac.via-ffmpeg.ogg  > bbb-100K.ogg
  % Total    % Received % Xferd  Average Speed   Time    Time     Time  Current
                                 Dload  Upload   Total   Spent    Left  Speed
100   97k  100   97k    0     0   8398      0  0:00:11  0:00:11 --:--:-- 25621

real 0m11.913s
user 0m0.004s
sys  0m0.006s
With 1.7.1 and flogtool tail:
$ time curl --range 0-100000 http://localhost:3456/file/URI%3ACHK%3A4klgnafrwsm2nx3bqy24ygac5a%3Acrz7nhthi4bevzrug6xwgif2vhiacp7wk2cfmjutoz2ns3w45qza%3A3%3A10%3A1490710513/@@named=/bbb-360p24.i420.lossless.drc.ogg.fixed.ogg%2Bbbb-24fps.flac.via-ffmpeg.ogg  > bbb-100Kb.ogg
  % Total    % Received % Xferd  Average Speed   Time    Time     Time  Current
                                 Dload  Upload   Total   Spent    Left  Speed
100   97k  100   97k    0     0  11044      0  0:00:09  0:00:09 --:--:-- 24679

real 0m9.062s
user 0m0.003s
sys  0m0.006s
v1.7.1 without tail:
$ time curl --range 0-100000 http://localhost:3456/file/URI%3ACHK%3A4klgnafrwsm2nx3bqy24ygac5a%3Acrz7nhthi4bevzrug6xwgif2vhiacp7wk2cfmjutoz2ns3w45qza%3A3%3A10%3A1490710513/@@named=/bbb-360p24.i420.lossless.drc.ogg.fixed.ogg%2Bbbb-24fps.flac.via-ffmpeg.ogg  > bbb-100Kc.ogg
  % Total    % Received % Xferd  Average Speed   Time    Time     Time  Current
                                 Dload  Upload   Total   Spent    Left  Speed
100   97k  100   97k    0     0   8134      0  0:00:12  0:00:12 --:--:-- 23310

real 0m12.301s
user 0m0.004s
sys  0m0.006s
v1.7.1 and flogtool tail:
$ time curl --range 0-100000 http://localhost:3456/file/URI%3ACHK%3A4klgnafrwsm2nx3bqy24ygac5a%3Acrz7nhthi4bevzrug6xwgif2vhiacp7wk2cfmjutoz2ns3w45qza%3A3%3A10%3A1490710513/@@named=/bbb-360p24.i420.lossless.drc.ogg.fixed.ogg%2Bbbb-24fps.flac.via-ffmpeg.ogg  > bbb-100Kd.ogg
  % Total    % Received % Xferd  Average Speed   Time    Time     Time  Current
                                 Dload  Upload   Total   Spent    Left  Speed
100   97k  100   97k    0     0   9050      0  0:00:11  0:00:11 --:--:-- 24716

real 0m11.057s
user 0m0.004s
sys  0m0.006s
Now switched from office to home. v1.7.1 and no flogtool tail, 1M:
$ time curl --range 0-1000000 http://localhost:3456/file/URI%3ACHK%3A4klgnafrwsm2nx3bqy24ygac5a%3Acrz7nhthi4bevzrug6xwgif2vhiacp7wk2cfmjutoz2ns3w45qza%3A3%3A10%3A1490710513/@@named=/bbb-360p24.i420.lossless.drc.ogg.fixed.ogg%2Bbbb-24fps.flac.via-ffmpeg.ogg  > bbb-1M.ogg
  % Total    % Received % Xferd  Average Speed   Time    Time     Time  Current
                                 Dload  Upload   Total   Spent    Left  Speed
100  976k  100  976k    0     0  33899      0  0:00:29  0:00:29 --:--:--  287k

real 0m29.509s
user 0m0.006s
sys  0m0.013s
v1.7.1 and flogtool tail, 1M:
$ time curl --range 0-1000000 http://localhost:3456/file/URI%3ACHK%3A4klgnafrwsm2nx3bqy24ygac5a%3Acrz7nhthi4bevzrug6xwgif2vhiacp7wk2cfmjutoz2ns3w45qza%3A3%3A10%3A1490710513/@@named=/bbb-360p24.i420.lossless.drc.ogg.fixed.ogg%2Bbbb-24fps.flac.via-ffmpeg.ogg  > bbb-1M.ogg
  % Total    % Received % Xferd  Average Speed   Time    Time     Time  Current
                                 Dload  Upload   Total   Spent    Left  Speed
100  976k  100  976k    0     0  51857      0  0:00:19  0:00:19 --:--:--  228k

real 0m19.294s
user 0m0.005s
sys  0m0.012s
v1.7.1 and no flogtool tail, 100K:
$ time curl --range 0-100000 http://localhost:3456/file/URI%3ACHK%3A4klgnafrwsm2nx3bqy24ygac5a%3Acrz7nhthi4bevzrug6xwgif2vhiacp7wk2cfmjutoz2ns3w45qza%3A3%3A10%3A1490710513/@@named=/bbb-360p24.i420.lossless.drc.ogg.fixed.ogg%2Bbbb-24fps.flac.via-ffmpeg.ogg  > bbb-100K.ogg
  % Total    % Received % Xferd  Average Speed   Time    Time     Time  Current
                                 Dload  Upload   Total   Spent    Left  Speed
100   97k  100   97k    0     0   2499      0  0:00:40  0:00:40 --:--:-- 25031

real 0m40.018s
user 0m0.005s
sys  0m0.011s
v1.7.1 and flogtool tail, 100K:
$ time curl --range 0-100000 http://localhost:3456/file/URI%3ACHK%3A4klgnafrwsm2nx3bqy24ygac5a%3Acrz7nhthi4bevzrug6xwgif2vhiacp7wk2cfmjutoz2ns3w45qza%3A3%3A10%3A1490710513/@@named=/bbb-360p24.i420.lossless.drc.ogg.fixed.ogg%2Bbbb-24fps.flac.via-ffmpeg.ogg  > bbb-100K.ogg
  % Total    % Received % Xferd  Average Speed   Time    Time     Time  Current
                                 Dload  Upload   Total   Spent    Left  Speed
100   97k  100   97k    0     0   5249      0  0:00:19  0:00:19 --:--:-- 24746

real 0m19.059s
user 0m0.005s
sys  0m0.009s
v1.8.0c2 and no flogtool tail, 100K:
$ time curl --range 0-100000 http://localhost:3456/file/URI%3ACHK%3A4klgnafrwsm2nx3bqy24ygac5a%3Acrz7nhthi4bevzrug6xwgif2vhiacp7wk2cfmjutoz2ns3w45qza%3A3%3A10%3A1490710513/@@named=/bbb-360p24.i420.lossless.drc.ogg.fixed.ogg%2Bbbb-24fps.flac.via-ffmpeg.ogg  > bbb-100K.ogg
  % Total    % Received % Xferd  Average Speed   Time    Time     Time  Current
                                 Dload  Upload   Total   Spent    Left  Speed
100   97k  100   97k    0     0  80318      0  0:00:01  0:00:01 --:--:-- 80516

real 0m1.253s
user 0m0.004s
sys  0m0.005s
v1.8.0c2 and no flogtool tail, 1M:
$ time curl --range 0-1000000 http://localhost:3456/file/URI%3ACHK%3A4klgnafrwsm2nx3bqy24ygac5a%3Acrz7nhthi4bevzrug6xwgif2vhiacp7wk2cfmjutoz2ns3w45qza%3A3%3A10%3A1490710513/@@named=/bbb-360p24.i420.lossless.drc.ogg.fixed.ogg%2Bbbb-24fps.flac.via-ffmpeg.ogg  > bbb-1M.ogg
  % Total    % Received % Xferd  Average Speed   Time    Time     Time  Current
                                 Dload  Upload   Total   Spent    Left  Speed
100  976k  100  976k    0     0    98k      0  0:00:09  0:00:09 --:--:--  118k

real 0m9.961s
user 0m0.005s
sys  0m0.015s
v1.8.0c2 and flogtool tail, 1M:
$ time curl --range 0-1000000 http://localhost:3456/file/URI%3ACHK%3A4klgnafrwsm2nx3bqy24ygac5a%3Acrz7nhthi4bevzrug6xwgif2vhiacp7wk2cfmjutoz2ns3w45qza%3A3%3A10%3A1490710513/@@named=/bbb-360p24.i420.lossless.drc.ogg.fixed.ogg%2Bbbb-24fps.flac.via-ffmpeg.ogg  > bbb-1M.ogg
  % Total    % Received % Xferd  Average Speed   Time    Time     Time  Current
                                 Dload  Upload   Total   Spent    Left  Speed
100  976k  100  976k    0     0   210k      0  0:00:04  0:00:04 --:--:--  268k

real 0m4.645s
user 0m0.004s
sys  0m0.009s
Changed at 2010-08-13T05:47:09Z by zooko
Changed at 2010-08-13T05:47:25Z by zooko
Changed at 2010-08-13T05:49:41Z by zooko
comment:15 Changed at 2010-08-13T05:57:27Z by zooko
I just did one more download with 1.7.1 of 1M in order to get both the status page and the flog I named this download "run 99" so that I could keep its status page, flog, and stdout separate from all the others on this ticket. Here is run 99, at my home, with Tahoe-LAFS v1.7.1, the first 1M of http://localhost:3456/file/URI%3ACHK%3A4klgnafrwsm2nx3bqy24ygac5a%3Acrz7nhthi4bevzrug6xwgif2vhiacp7wk2cfmjutoz2ns3w45qza%3A3%3A10%3A1490710513/@@named=/bbb-360p24.i420.lossless.drc.ogg.fixed.ogg%2Bbbb-24fps.flac.via-ffmpeg.ogg :
$ time curl --range 0-1000000 http://localhost:3456/file/URI%3ACHK%3A4klgnafrwsm2nx3bqy24ygac5a%3Acrz7nhthi4bevzrug6xwgif2vhiacp7wk2cfmjutoz2ns3w45qza%3A3%3A10%3A1490710513/@@named=/bbb-360p24.i420.lossless.drc.ogg.fixed.ogg%2Bbbb-24fps.flac.via-ffmpeg.ogg  > bbb-1M.ogg
  % Total    % Received % Xferd  Average Speed   Time    Time     Time  Current
                                 Dload  Upload   Total   Spent    Left  Speed
100  976k  100  976k    0     0  38477      0  0:00:25  0:00:25 --:--:--  245k'

real 0m25.999s
user 0m0.005s
sys  0m0.012s
I will now attach the status output and flog of run 99.
Changed at 2010-08-13T05:57:55Z by zooko
Changed at 2010-08-13T05:59:08Z by zooko
comment:16 Changed at 2010-08-13T06:14:54Z by zooko
I just did one more download with 1.8.0c2 of 1M in order to get both the status page and the flog I named this download "run 100" so that I could keep its status page, flog, and stdout separate from all the others on this ticket. Here is run 100, at my home, with Tahoe-LAFS v1.8.0c2, the first 1M of http://localhost:3456/file/URI%3ACHK%3A4klgnafrwsm2nx3bqy24ygac5a%3Acrz7nhthi4bevzrug6xwgif2vhiacp7wk2cfmjutoz2ns3w45qza%3A3%3A10%3A1490710513/@@named=/bbb-360p24.i420.lossless.drc.ogg.fixed.ogg%2Bbbb-24fps.flac.via-ffmpeg.ogg :
$ time curl --range 0-1000000 http://localhost:3456/file/URI%3ACHK%3A4klgnafrwsm2nx3bqy24ygac5a%3Acrz7nhthi4bevzrug6xwgif2vhiacp7wk2cfmjutoz2ns3w45qza%3A3%3A10%3A1490710513/@@named=/bbb-360p24.i420.lossless.drc.ogg.fixed.ogg%2Bbbb-24fps.flac.via-ffmpeg.ogg  > bbb-1M.ogg
  % Total    % Received % Xferd  Average Speed   Time    Time     Time  Current
                                 Dload  Upload   Total   Spent    Left  Speed
100  976k  100  976k    0     0   139k      0  0:00:06  0:00:06 --:--:--  169k

real 0m7.377s
user 0m0.004s
sys  0m0.010s
Changed at 2010-08-13T06:15:25Z by zooko
Changed at 2010-08-13T06:17:47Z by zooko
comment:17 Changed at 2010-08-13T06:21:12Z by zooko
- Keywords regression removed
- Milestone changed from 1.8.0 to eventually
- Priority changed from critical to major
Okay there's no solid evidence that there is a regression from 1.7.1. I think Brian should use this ticket to analyze my flogs and status pages if he wants and then change it to be a ticket about download server selection. :-) Removing "regression".
comment:18 Changed at 2010-08-13T06:52:56Z by zooko
I just did one more download with 1.8.0c2 of 100M in order to get both the status page and the flog I named this download "run 101" so that I could keep its status page, flog, and stdout separate from all the others on this ticket. Here is run 101, at my home, with Tahoe-LAFS v1.8.0c2, the first 1M of http://localhost:3456/file/URI%3ACHK%3A4klgnafrwsm2nx3bqy24ygac5a%3Acrz7nhthi4bevzrug6xwgif2vhiacp7wk2cfmjutoz2ns3w45qza%3A3%3A10%3A1490710513/@@named=/bbb-360p24.i420.lossless.drc.ogg.fixed.ogg%2Bbbb-24fps.flac.via-ffmpeg.ogg :
$ echo this is run 101 ; time curl --range 0-100000000 http://localhost:3456/file/URI%3ACHK%3A4klgnafrwsm2nx3bqy24ygac5a%3Acrz7nhthi4bevzrug6xwgif2vhiacp7wk2cfmjutoz2ns3w45qza%3A3%3A10%3A1490710513/@@named=/bbb-360p24.i420.lossless.drc.ogg.fixed.ogg%2Bbbb-24fps.flac.via-ffmpeg.ogg  > bbb-100M.ogg
this is run 101
  % Total    % Received % Xferd  Average Speed   Time    Time     Time  Current
                                 Dload  Upload   Total   Spent    Left  Speed
100 95.3M  100 95.3M    0     0  90900      0  0:18:20  0:18:20 --:--:-- 96978

real 18m20.118s
user 0m0.097s
sys  0m0.536s
Changed at 2010-08-13T06:54:30Z by zooko
Changed at 2010-08-13T06:59:15Z by zooko
comment:19 Changed at 2010-08-13T07:18:54Z by zooko
I just did one more download with 1.7.1 of 100M in order to get both the status page and the flog I named this download "run 102" so that I could keep its status page, flog, and stdout separate from all the others on this ticket. Here is run 102, at my home, with Tahoe-LAFS v1.7.1, the first 1M of http://localhost:3456/file/URI%3ACHK%3A4klgnafrwsm2nx3bqy24ygac5a%3Acrz7nhthi4bevzrug6xwgif2vhiacp7wk2cfmjutoz2ns3w45qza%3A3%3A10%3A1490710513/@@named=/bbb-360p24.i420.lossless.drc.ogg.fixed.ogg%2Bbbb-24fps.flac.via-ffmpeg.ogg :
$ echo this is run 102 ; time curl --range 0-100000000 http://localhost:3456/file/URI%3ACHK%3A4klgnafrwsm2nx3bqy24ygac5a%3Acrz7nhthi4bevzrug6xwgif2vhiacp7wk2cfmjutoz2ns3w45qza%3A3%3A10%3A1490710513/@@named=/bbb-360p24.i420.lossless.drc.ogg.fixed.ogg%2Bbbb-24fps.flac.via-ffmpeg.ogg  > bbb-100M.ogg
this is run 102
  % Total    % Received % Xferd  Average Speed   Time    Time     Time  Current
                                 Dload  Upload   Total   Spent    Left  Speed
100 95.3M  100 95.3M    0     0   182k      0  0:08:54  0:08:54 --:--:-- 26.3M

real 8m54.910s
user 0m0.066s
sys  0m0.478s
comment:20 Changed at 2010-08-13T07:19:10Z by zooko
Interesting that 1.7.1 was twice as fast as 1.8.0c2 this time.
Changed at 2010-08-13T07:19:48Z by zooko
comment:21 Changed at 2010-08-13T07:20:37Z by zooko
Annoyingly, 1.7.1 has a bug where it doesn't show downloads in the status page sometimes, and that happened this time, so I can't show you the status page for run 102.
comment:22 Changed at 2010-08-13T15:51:30Z by zooko
run 103 1.7.1 the first 100M http://localhost:3456/file/URI%3ACHK%3A4klgnafrwsm2nx3bqy24ygac5a%3Acrz7nhthi4bevzrug6xwgif2vhiacp7wk2cfmjutoz2ns3w45qza%3A3%3A10%3A1490710513/@@named=/bbb-360p24.i420.lossless.drc.ogg.fixed.ogg%2Bbbb-24fps.flac.via-ffmpeg.ogg
$ echo this is run 103 ; time curl --range 0-100000000 http://localhost:3456/file/URI%3ACHK%3A4klgnafrwsm2nx3bqy24ygac5a%3Acrz7nhthi4bevzrug6xwgif2vhiacp7wk2cfmjutoz2ns3w45qza%3A3%3A10%3A1490710513/@@named=/bbb-360p24.i420.lossless.drc.ogg.fixed.ogg%2Bbbb-24fps.flac.via-ffmpeg.ogg  > bbb-100M.ogg
this is run 103
  % Total    % Received % Xferd  Average Speed   Time    Time     Time  Current
                                 Dload  Upload   Total   Spent    Left  Speed
100 95.3M  100 95.3M    0     0   207k      0  0:07:50  0:07:50 --:--:-- 27.1M

real 7m50.696s
user 0m0.063s
sys  0m0.469s
Changed at 2010-08-13T15:52:22Z by zooko
comment:23 Changed at 2010-08-13T17:51:36Z by zooko
run 104
1.8.0rc2-4698
the first 100M
$ echo this is run 104 ; time curl --range 0-100000000 http://localhost:3456/file/URI%3ACHK%3A4klgnafrwsm2nx3bqy24ygac5a%3Acrz7nhthi4bevzrug6xwgif2vhiacp7wk2cfmjutoz2ns3w45qza%3A3%3A10%3A1490710513/@@named=/bbb-360p24.i420.lossless.drc.ogg.fixed.ogg%2Bbbb-24fps.flac.via-ffmpeg.ogg  > bbb-100M.ogg
this is run 104
  % Total    % Received % Xferd  Average Speed   Time    Time     Time  Current
                                 Dload  Upload   Total   Spent    Left  Speed
100 95.3M  100 95.3M    0     0  81763      0  0:20:23  0:20:23 --:--:-- 57095

real 20m23.119s
user 0m0.102s
sys  0m0.554s
Changed at 2010-08-13T17:54:57Z by zooko
comment:24 Changed at 2010-08-13T17:56:14Z by zooko
- Keywords regression added
- Milestone changed from eventually to 1.8.0
- Priority changed from major to critical
Hm, okay it really looks like there is a substantial (2X) slowdown for using Tahoe-LAFS v1.8.0c2 instead of v1.7.1 on today's (and yesterday's) Test Grid. I'm re-adding the regression tag which means I think this issue should block 1.8.0 release until we at least understand it better.
Changed at 2010-08-13T17:57:41Z by zooko
comment:25 Changed at 2010-08-13T18:45:51Z by zooko
run 105
1.7.1
the first 100M
$ echo this is run 105 tahoe-lafs v1.7.1 ; time curl --range 0-100000000 http://localhost:3456/file/URI%3ACHK%3A4klgnafrwsm2nx3bqy24ygac5a%3Acrz7nhthi4bevzrug6xwgif2vhiacp7wk2cfmjutoz2ns3w45qza%3A3%3A10%3A1490710513/@@named=/bbb-360p24.i420.lossless.drc.ogg.fixed.ogg%2Bbbb-24fps.flac.via-ffmpeg.ogg  > bbb-100M.ogg
this is run 105 tahoe-lafs v1.7.1
  % Total    % Received % Xferd  Average Speed   Time    Time     Time  Current
                                 Dload  Upload   Total   Spent    Left  Speed
100 95.3M  100 95.3M    0     0   211k      0  0:07:40  0:07:40 --:--:-- 19.8M

real 7m41.179s
user 0m0.061s
sys  0m0.481s
Changed at 2010-08-13T18:46:45Z by zooko
comment:26 Changed at 2010-08-13T19:10:39Z by zooko
run 106
1.8.0c2-r4698
the first 100M
$ echo this is run 106 tahoe-lafs v1.8.0c2-r4698 ; time curl --range 0-100000000 http://localhost:3456/file/URI%3ACHK%3A4klgnafrwsm2nx3bqy24ygac5a%3Acrz7nhthi4bevzrug6xwgif2vhiacp7wk2cfmjutoz2ns3w45qza%3A3%3A10%3A1490710513/@@named=/bbb-360p24.i420.lossless.drc.ogg.fixed.ogg%2Bbbb-24fps.flac.via-ffmpeg.ogg  > bbb-100M.ogg
this is run 106 tahoe-lafs v1.8.0c2-r4698
  % Total    % Received % Xferd  Average Speed   Time    Time     Time  Current
                                 Dload  Upload   Total   Spent    Left  Speed
100 95.3M  100 95.3M    0     0   112k      0  0:14:29  0:14:29 --:--:-- 94083

real 14m29.309s
user 0m0.082s
sys  0m0.528s
Changed at 2010-08-13T19:11:57Z by zooko
Changed at 2010-08-13T19:12:57Z by zooko
comment:27 follow-up: ↓ 29 Changed at 2010-08-14T01:52:35Z by warner
I had an idea for a not-too-complex share-selection algorithm this morning:
- first, have the ShareFinder report all shares as soon as it learns about them, instead of its current behavior of withholding them until someone says that they're hungry
- also record the DYHB RTT in each Share object, so it can be found later. Keep the list of Shares sorted by this RTT (with share-number as the secondary sort key).
- then, each time the SegmentFetcher needs to start using a new share, use the following algorithm:
sharemap = {} # maps shnum to Share instance
num_shares_per_server = {} # maps Server to a count of shares
for max_shares_per_server in itertools.count(1):
  progress = False
  for sh in shares:
    if sh.shnum in sharemap:
      continue
    if num_shares_per_server[sh.server] >= max_shares_per_server:
      continue
    sharemap[sh.shnum] = sh
    num_shares_per_server[sh.server] += 1
    progress = True
    if len(sharemap) >= k:
      return SUCCESS
  if not progress:
    return FAIL
The general idea is to cycle through all the shares we know about, but first try to build a sharemap that only uses one share per server (i.e. perfect diversity). That might fail because the shares are not diverse enough, so we can walk through the loop a second time and be willing to accept two shares per server. If that fails, we raise our willingness to three shares per server, etc. If we ever finish a loop without adding at least one share to our sharemap, we declare failure: this indicates that there are not enough distinct shares (that we know about so far) to succeed.
If this returns FAIL, that really means we should declare "hunger" and ask the ShareFinder to look for more shares. If we return SUCCESS but max_shares_per_server > 1, then we should ask for more shares too (but start the segment anyways: new shares may help the next segment do better).
This is still vulnerable to certain pathological situations, like if everybody has a copy of sh0 but only the first server has a copy of sh1: this will use sh0 from the first server then circle around and have to use sh1 from that server as well. A smarter algorithm would peek ahead, realize the scarcity of sh1, and add sh1 from the first server so it could get sh0 from one of the other servers instead.
But I think this might improve the diversity of downloads without going down the full itertools.combinations-enumerating route that represents the "complete" way to approach this problem.
comment:28 follow-up: ↓ 30 Changed at 2010-08-14T03:47:11Z by zooko
This seems promising. It sounds like you might think that the slowdown of 1.8.0c2 vs. 1.7.1 on the current Test Grid might be due to one server being used to serve two shares in 1.8.0c2 when two different servers would be used—one for each share—in 1.7.1. Is that what you think? Have you had a chance to look at my flogs attached to this ticket to confirm that this is what is happening?
comment:29 in reply to: ↑ 27 Changed at 2010-08-14T05:18:37Z by zooko
Replying to warner:
But I think this might improve the diversity of downloads without going down the full itertools.combinations-enumerating route that represents the "complete" way to approach this problem.
(Parenthetical historical observation which is pleasurable to me: Your heuristic algorithm for server selection (for download) in comment:27, and your observation that it is susceptible to failure in certain cases, is similar to my proposed heuristic algorithm for server selection for upload in #778 (comment:156:ticket:778, for the benefit of future cyborg archaeologist historians). David-Sarah then observed that finding the optimal solution was a standard graph theory problem named "maximum matching of a bipartite graph". Kevan then implemented it and thus we were able to finish #778.)
My copy of Cormen, Leiserson, Rivest 1st Ed. says (chapter 27.3) that the Ford-Fulkerson solution requires computation O(V * E) where V is the number of vertices (num servers plus num shares) and E is the number of edges (number of (server, share) tuples).
Now what Kevan actually implemented in happinessutil.py just returns the size of the maximum matching, and what we want here is an actual matching. I'm not 100% sure but I think if you save all the path's that are returned from augmenting_path_for() in servers_of_happiness() and return the resulting set of paths then you'll have your set of server->share mappings.
comment:30 in reply to: ↑ 28 Changed at 2010-08-14T06:08:34Z by zooko
Replying to zooko:
This seems promising. It sounds like you might think that the slowdown of 1.8.0c2 vs. 1.7.1 on the current Test Grid might be due to one server being used to serve two shares in 1.8.0c2 when two different servers would be used—one for each share—in 1.7.1.
Okay this does appear to be happening in at least one of the slow v1.8.0c2 downloads attached to this ticket. I looked at attachment:1.8.0c2-r4698-run-106-down-0.html and every request-block in it (for three different shares) went to the same server -- nszizgf5 -- which was the first server to respond to the DYHB (barely) and which happened to be the only server that had three shares. So at least for that run, Brian's idea that fetching blocks of different shares from the same server is a significant slowdown seems to be true.
comment:31 Changed at 2010-08-14T07:02:04Z by zooko
- Summary changed from does new-downloader perform badly for certain situations (such as today's Test Grid)? to new-downloader performs badly when the first server to reply to DYHB has K shares
comment:32 Changed at 2010-08-15T04:08:45Z by zooko
In http://tahoe-lafs.org/pipermail/tahoe-dev/2010-August/004998.html I wrote:
Hey waitasecond. As far as I understand, Tahoe-LAFS v1.7.1 should also—just like v1.8.0c2—start downloading all three shares from Greg's server as soon as that server is the first responder to the DYHB:
Am I misunderstanding? So the question of why 1.7.1 seems to download 2 or 3 times as fast as 1.8.0c2 on this grid remains open.
comment:33 Changed at 2010-08-16T05:25:21Z by zooko
run 107
1.7.1
the first 10MB
with cProfile profiling running but no flog running
$ echo this is run 107 tahoe-lafs v1.7.1 cProfile ; time curl --range 0-10000000 http://localhost:3456/file/URI%3ACHK%3A4klgnafrwsm2nx3bqy24ygac5a%3Acrz7nhthi4bevzrug6xwgif2vhiacp7wk2cfmjutoz2ns3w45qza%3A3%3A10%3A1490710513/@@named=/bbb-360p24.i420.lossless.drc.ogg.fixed.ogg%2Bbbb-24fps.flac.via-ffmpeg.ogg  > bbb-10M.ogg
this is run 107 tahoe-lafs v1.7.1 cProfile
  % Total    % Received % Xferd  Average Speed   Time    Time     Time  Current
                                 Dload  Upload   Total   Spent    Left  Speed
100 9765k  100 9765k    0     0   171k      0  0:00:57  0:00:57 --:--:-- 2424k

real    0m57.139s
user    0m0.010s
sys     0m0.059s
Changed at 2010-08-16T05:28:11Z by zooko
comment:34 Changed at 2010-08-16T05:36:27Z by zooko
run 108
1.8.0c2
the first 10MB
with cProfile profiling running but no flog running
$ echo this is run 108 tahoe-lafs v1.8.0c2 cProfile ; time curl --range 0-10000000 http://localhost:3456/file/URI%3ACHK%3A4klgnafrwsm2nx3bqy24ygac5a%3Acrz7nhthi4bevzrug6xwgif2vhiacp7wk2cfmjutoz2ns3w45qza%3A3%3A10%3A1490710513/@@named=/bbb-360p24.i420.lossless.drc.ogg.fixed.ogg%2Bbbb-24fps.flac.via-ffmpeg.ogg  > bbb-10M.ogg
this is run 108 tahoe-lafs v1.8.0c2 cProfile
  % Total    % Received % Xferd  Average Speed   Time    Time     Time  Current
                                 Dload  Upload   Total   Spent    Left  Speed
100 9765k  100 9765k    0     0   247k      0  0:00:39  0:00:39 --:--:--  264k

real    0m39.496s
user    0m0.009s
sys     0m0.052s
Changed at 2010-08-16T05:37:29Z by zooko
comment:35 Changed at 2010-08-16T05:53:28Z by zooko
run 109
1.7.1
the first 100MB
with cProfile profiling running but no flog running
$ echo this is run 109 tahoe-lafs v1.7.1 cProfile ; time curl --range 0-100000000 http://localhost:3456/file/URI%3ACHK%3A4klgnafrwsm2nx3bqy24ygac5a%3Acrz7nhthi4bevzrug6xwgif2vhiacp7wk2cfmjutoz2ns3w45qza%3A3%3A10%3A1490710513/@@named=/bbb-360p24.i420.lossless.drc.ogg.fixed.ogg%2Bbbb-24fps.flac.via-ffmpeg.ogg  > bbb-100M.ogg
this is run 109 tahoe-lafs v1.7.1 cProfile
  % Total    % Received % Xferd  Average Speed   Time    Time     Time  Current
                                 Dload  Upload   Total   Spent    Left  Speed
100 95.3M  100 95.3M    0     0   228k      0  0:07:06  0:07:06 --:--:-- 21.5M

real    7m6.626s
user    0m0.059s
sys     0m0.460s
Changed at 2010-08-16T05:53:54Z by zooko
comment:36 Changed at 2010-08-16T06:13:37Z by zooko
run 110
1.8.0c2
the first 100MB
with cProfile profiling running but no flog running
$ echo this is run 110 tahoe-lafs v1.8.0c2 cProfile ; time curl --range 0-100000000 http://localhost:3456/file/URI%3ACHK%3A4klgnafrwsm2nx3bqy24ygac5a%3Acrz7nhthi4bevzrug6xwgif2vhiacp7wk2cfmjutoz2ns3w45qza%3A3%3A10%3A1490710513/@@named=/bbb-360p24.i420.lossless.drc.ogg.fixed.ogg%2Bbbb-24fps.flac.via-ffmpeg.ogg  > bbb-100M.ogg
this is run 110 tahoe-lafs v1.8.0c2 cProfile
  % Total    % Received % Xferd  Average Speed   Time    Time     Time  Current
                                 Dload  Upload   Total   Spent    Left  Speed
100 95.3M  100 95.3M    0     0   113k      0  0:14:19  0:14:19 --:--:--   98k

real    14m19.256s
user    0m0.079s
sys     0m0.504s
Changed at 2010-08-16T06:14:33Z by zooko
Changed at 2010-08-16T06:17:45Z by zooko
comment:37 follow-up: ↓ 44 Changed at 2010-08-16T06:22:55Z by zooko
- Summary changed from new-downloader performs badly when the first server to reply to DYHB has K shares to new-downloader performs badly when downloading a lot of data from a file
Okay, the problem with the current downloader in 1.8.0c2 is that it goes slower and slower as it downloads more and more data from a file. It consistently wins (or at least ties) 1.7.1 in downloads <= 10MB but consistently loses badly for 100 MB. Also the profiling result in attachment:prof-run-110-dump.txt shows major CPU usage in spans:
         661324561 function calls (661269650 primitive calls) in 919.130 CPU seconds

   Ordered by: standard name

   ncalls  tottime  percall  cumtime  percall filename:lineno(function)
    91950    0.464    0.000    0.646    0.000 spans.py:142(dump)
  1374341    0.310    0.000    0.310    0.000 spans.py:152(__iter__)
    41352    0.062    0.000    0.149    0.000 spans.py:156(__nonzero__)
   142497    0.194    0.000    0.253    0.000 spans.py:159(len)
    18390    0.059    0.000    0.438    0.000 spans.py:164(__add__)
    22962    1.083    0.000    8.079    0.000 spans.py:170(__sub__)
     9195    0.034    0.000    0.346    0.000 spans.py:186(__and__)
153765314  121.874    0.000  197.580    0.000 spans.py:203(overlap)
153189988   54.374    0.000   54.374    0.000 spans.py:215(adjacent)
    18390    1.032    0.000    1.343    0.000 spans.py:238(len)
    18390    5.727    0.000    7.413    0.000 spans.py:248(dump)
    87347    1.430    0.000  460.111    0.005 spans.py:25(__init__)
     9195    0.633    0.000  459.852    0.050 spans.py:256(get_spans)
     6906    0.114    0.000    0.115    0.000 spans.py:260(assert_invariants)
     9193    0.305    0.000    0.372    0.000 spans.py:271(get)
     6906    2.174    0.000    3.233    0.000 spans.py:295(add)
  2678832   32.014    0.000   46.032    0.000 spans.py:34(_check)
     6904    0.742    0.000    1.630    0.000 spans.py:389(remove)
     3436    0.007    0.000    0.042    0.000 spans.py:434(pop)
  1315865  140.193    0.000  458.353    0.000 spans.py:46(add)
  1275620    2.471    0.000    6.287    0.000 spans.py:82(remove)
comment:38 Changed at 2010-08-16T07:01:29Z by zooko
Looking at immutable/downloader/share.py, I have the following review comments:
- This comment confuses me:
59           self._pending = Spans() # request sent but no response received yet
60	        self._received = DataSpans() # ACK response received, with data
61	        self._unavailable = Spans() # NAK response received, no data
62
63	        # any given byte of the share can be in one of four states:
64	        #  in: _wanted, _requested, _received
65	        #      FALSE    FALSE       FALSE : don't care about it at all
66	        #      TRUE     FALSE       FALSE : want it, haven't yet asked for it
67	        #      TRUE     TRUE        FALSE : request is in-flight
68	        #                                   or didn't get it
69	        #      FALSE    TRUE        TRUE  : got it, haven't used it yet
70	        #      FALSE    TRUE        FALSE : got it and used it
71	        #      FALSE    FALSE       FALSE : block consumed, ready to ask again
Are _wanted, _requested, and _received old names for _pending, _received, and _unavailable? Or perhaps from a different design entirely? And that's six states, not four.
- A span is add'ed to _pending in _send_requests() and removed from _pending in _got_data() but is not removed if the request errbacks instead of callbacks. That would be a bug for it still to be marked as "pending" after the request errbacked, wouldn't it?
- We shouldn't give the author of a file the ability to raise AssertionError from immutable/downloader/share.py line 416 _satisfy_share_hash_tree() but instead give him the ability to cause _satisfy_offsets() to raise a LayoutInvalid exception (see related ticket #1085 (we shouldn't use "assert" to validate incoming data in introducer client))
comment:39 Changed at 2010-08-16T07:18:19Z by zooko
This looks like a bug: share.py _got_data():
self._received.add(start, data)
That could explain the slowdown -- the items added to _received here are never removed, because the removal code in _satisfy_block_data() is:
block = self._received.pop(blockstart, blocklen)
I added the following assertions to trunk/src/allmydata/util/spans.py@4666:
hunk ./src/allmydata/util/spans.py 47
             raise

     def add(self, start, length):
+        assert isinstance(start, (int, long))
+        assert isinstance(length, (int, long))
         assert start >= 0
         assert length > 0
         #print " ADD [%d+%d -%d) to %s" % (start, length, start+length, self.dump())
And indeed these assertions fail because data is not an integer. However, then when I add this patch:
hunk ./src/allmydata/immutable/downloader/share.py 741
                 share=repr(self), start=start, length=length, datalen=len(data),
                 level=log.NOISY, parent=lp, umid="5Qn6VQ")
         self._pending.remove(start, length)
-        self._received.add(start, data)
+        self._received.add(start, length)

         # if we ask for [a:c], and we get back [a:b] (b<c), that means we're
         # never going to get [b:c]. If we really need that data, this block
This causes a bunch of tests to fail in ways that I don't understand.
comment:40 Changed at 2010-08-16T07:35:04Z by zooko
more review notes:
- In spans add() it would be more efficient to use bisect.insort()
- In spans remove() it would be more efficient to insert the new span, e.g. replace
                    self._spans[i] = (left_start, left_length)
                    self._spans.append( (right_start, right_length) )
                    self._spans.sort()
with
                    self._spans[i] = (left_start, left_length)
                    self._spans.insert(i+1, (right_start, right_length))
- DataSpans.add() calls assert_invariants() which iterates over all the spans. Also DataSpans.add() itself searches for where to make modifications by iterating from the beginning, which seems unnecessary. Couldn't it do a binary search to find the place it needs to modify and then modify only a local neighborhood there?
comment:41 Changed at 2010-08-16T07:37:16Z by zooko
In immutable/downloader/share.py _unavailable can have things added to it (in case of intentional over-read or in case of failing/corrupted server) but never has things removed from it. Does that matter? I suspect that it is intentional and doesn't hurt but I'm not sure.
comment:42 Changed at 2010-08-16T14:17:54Z by zooko
Also Brian discovered another bug in new-downloader last night. Here are some excerpts from IRC.
<warner> hm, ok, so my new share-selection algorithm is, I think, revealing a
	 bug in the rest of the downloader code			        [23:54]
<warner> there's a funny place where the number of segments in the file
	 (needed to build the block-hash-tree) is not known right away,
	 because we have to get the UEB to know for sure	        [23:55]
<warner> so the CommonShare object speculatively creates an
	 IncompleteHashTree, with a guessed value for numsegs
<warner> and then replaces it later
<warner> (in hindsight, it's probably not a good idea to do that.. I should
	 just leave it as None until we know for sure)		        [23:56]
<warner> the test failure is that the first segment uses sh0,sh1,sh5 , and all
	 have their numsegs updated, but the second segment then switches to
	 some different shares, and those new ones are still using the guessed
	 value for numsegs					        [23:57]
<warner> seg1 used sh0,1,6
<zooko> Hm.							        [23:58]
<zooko> Good find!
<warner> and sh6 threw an exception because of the wrong-sized hashtree, so it
	 fell back to sh5
<warner> each time it tried to use a share that wasn't part of the original
	 set, it got that error and returned back to sh0,1,5	        [23:59]
comment:43 follow-up: ↓ 46 Changed at 2010-08-16T18:14:04Z by warner
Responses to earlier comments:
- spans.py definitely looks O()-suspicious. Does attachment:prof-run-110-dump.txt suggest that in a 100MB file download, we spent half of the total time in Spans.__init__?
- yes, the comment about _wanted, _requested, _received is stale.
- the failure to remove data from _pending upon errback is a bug
- LayoutInvalid is better than assert, yeah
- the self._received.add(start,data) is correct: _received is a
DataSpans instance, not Spans, and it holds strings, not
booleans. _received holds the data that comes back from the server
until the "satisfy" code consumes it. It has methods like get and
pop, whereas the simpler Spans class merely has methods for
is-range-in-span.
- that said, I don't understand how assertions added to spans.py#L47 would ever fire. If those same assertions were added to spans.py#L295, I'd get it. What types were start/length in your observed assertion failures? And what was the stack trace?
- The patch to call self._received.add(start, length) is wrong; it must be called with (int,str).
- all the comments about efficiency improvements in Spans are probably correct
- adding data to _unavailable should be benign: the amount of unavailable data is small and constant (if the share is intact, we should only add to _unavailable during the first few reads if we've guessed the segsize wrong).
Now some new ideas. I've found a couple of likely issues.
- looking at timestamps from flog-run-106, the inter-segment timing
definitely is growing over the course of the download. It's noisy,
but it goes from about 0.8s at the start (seg0), to about 1.5s-2.0s at the
end (seg762). I haven't looked at smaller deltas (i.e. only inside the
"desire" code) to rule out network variations, but it certainly points to
a leak or complexity increase of some sort that gets worse as the download
progresses.
- comparing downloads of the first 100MB, the middle 100MB, and the last 100MB would rule out anything that's influenced by the absolute segment number.
- looking at the Spans.dump() strings in the flog, I see that two of
the three shares (sh7+sh8) have an ever-growing .received
DataSpans structure. A cursory check suggests they are growing by 64
bytes and one range per segment. By the end of the download (seg762), sh7
is holding 37170 bytes in 378 ranges (whereas sh3 only has 1636 bytes in
22 ranges, and remains mostly constant)
- This means that we're asking for data which we then don't end up using. We keep it around in _received because it might be useful later: maybe we ask for the wrong data because our guess of the segsize (and thus numsegs, and thus the size/placement of the hashtrees) was wrong. But later we might take advantage of whatever we fetched by mistake.
- I have two theories:
- the IncompleteHashTree.needed_hashes() call, when asked what hashes we need to validate leaf 0, might tell us we need the hash for leaf 0 too. However, that hash can be computed from the block of data that makes up the leaf, so we don't really need to fetch it. (whereas we *do* need the hash for leaf 1, since it sits on the "uncle chain" for leaf0). If the desire-side code is conservatively/incorrectly asking for the leaf0 hash, but the satisfy-side code doesn't use it, then we'll add a single 32-byte hash node per segment.
- ciphertext hash tree nodes: when we start working on a segment, the desire-side code will ask for ciphertext hash tree nodes from each segment we're using. However, the satisfy-side code will only use the hashes from the first response: by the time the second response arrives, the ciphertext hash tree is satisfied, so that clause isn't reached. This means that we'll leave that data in ._received forever. This seems most likely: it would explain why the first share (sh3) doesn't grow, whereas the later two shares do, and why I saw a 64-byte increment (the actual growth would depend upon the segment number, and how many new uncle-chain nodes are needed, but 2-nodes is a fairly common value).
- The .received leftover-data issue shouldn't be such a big deal, N=378 is not a huge number, but the measured increase in inter-segment time suggests that whatever the O() complexity is, N=378 is enough to cause problems.
So I think the next directions to pursue are:
- build some kind of test framework to exercise a large download without using real remote_read calls, ideally 100MB or 1GB in a few seconds. This would use a Share subclass that returns data immediately (well, after a eventual-send) rather than ever touching a server. It might also need to stub out some of the hashtree checks, but does need real needed_hashes computations. Then we fix the code until this test finishes in a reasonable amount of time. While I wouldn't have the test case assert anything about runtime, I would have it assert things like ._received doesn't grow over the course of the test.
- measure the CPU seconds needed to download a 100MB file from both old-downloader and new-downloader: if we're looking at a O(n3) problem, it will manifest as a much heavier CPU load. (if we were merely looking at a pipelining failure, the CPU time would be the same, but wallclock time would be higher).
- stare at Spans (and specifically DataSpans) for computational-complexity problems. Build some tests of these with N=400ish and see how efficient they are. They're supposed to be linear wrt number-of-ranges, but either they aren't, or they're being called in a way which makes it worse
- consider commenting out the dump() calls for a test, or some assert_invariants calls, to see if we're hitting that old problem where the data structure is efficient unless we leave in the self-checks or debugging messages
- (hard) figure out how to drop the unused ciphertext-hash-tree nodes from the second and later shares
- look at IncompleteHashTree.needed_hashes and see if we're actually requesting the leaf node that we don't really need.
- consider an entirely different DataSpans structure. The
perhaps-too-clever overlap/merge behavior is mostly just exercised during
the fetch of the first segment, before we're sure about the correct number
of segments (we fetch some data speculatively to reduce roundtrips; if we
guess wrong, we'll get the wrong data, but DataSpans lets us easily
use that data later if it turns out to be what we needed for some other
purpose). Perhaps a data structure which was less tuned for merging
adjacent ranges would be better, maybe one which has an explicit
merge() method that's only called just before the requests are sent
out. Or maybe the value of holding on to that data isn't enough to justify
the complexity.
- a related thought (mostly to remind me of the idea later): for pipelining purposes, I'd like to be able to label the bits in a Spans with their purpose: if we send parallel requests for both seg2 and seg3, I'd like the seg2 data to arrive first, so e.g. the hashes needed to validate seg2 should arrive before the bulk block data for seg3. A label on the bits like "this is for seg2" would let us order the requests in such a way to reduce our memory footprint. A label like this might also be useful for handling the unused-ciphertext-hash-tree-nodes problem, if we could remove data from a DataSpans that's labelled with an already-complete segnum.
Finally, the bug zooko mentioned in comment:42 is real. I'm still working on it, but basically it prevents us from using shares that arrive after the initial batch of requests: they are not initialized properly and don't get a correct block hash tree. I'm working on a fix. The symptom is that we fall back to the initial shares, but if those have died, the download will fail, which is wrong.
And I'm still working on the new share-selection algorithm. The code works, and my basic unit tests work, but certain ones require the comment:42 bug to be fixed before it is safe to use (the bug will hurt current downloads, but occurs less frequently).
Changed at 2010-08-16T21:54:35Z by davidsarah
Short-term hack to test for asymptotic inefficiency of DataSpans?.get_spans
comment:44 in reply to: ↑ 37 ; follow-up: ↓ 45 Changed at 2010-08-16T22:13:42Z by davidsarah
Replying to zooko:
Okay, the problem with the current downloader in 1.8.0c2 is that it goes slower and slower as it downloads more and more data from a file. It consistently wins (or at least ties) 1.7.1 in downloads <= 10MB but consistently loses badly for 100 MB. Also the profiling result in attachment:prof-run-110-dump.txt shows major CPU usage in spans:
   ncalls  tottime  percall  cumtime  percall filename:lineno(function)
...
    87347    1.430    0.000  460.111    0.005 spans.py:25(__init__)
     9195    0.633    0.000  459.852    0.050 spans.py:256(get_spans)
...
  1315865  140.193    0.000  458.353    0.000 spans.py:46(add)
This is the smoking gun. The code of DataSpans.get_spans is:
    def get_spans(self):
        """Return a Spans object with a bit set for each byte I hold"""
        return Spans([(start, len(data)) for (start,data) in self.spans])
and the Spans constructor has the loop:
    for (start,length) in _span_or_start:
        self.add(start, length)
Spans.add does a linear search (plus a sort, if there is no overlap, but Timsort takes linear time for an already-sorted array), so the overall complexity of DataSpans.get_spans is Θ(n2) where n is the number of spans.
Since Spans uses essentially the same invariant as DataSpans for its array of spans (they are sorted with no overlaps or adjacency), it is possible to implement get_spans in Θ(1) time. However I suspect that the important difference here is between Θ(n2) and Θ(n).
The diff's implementation of get_spans includes a call to s._check. It may also be worth doing another profile run without that call.
(Some of my comments in ticket:798#comment:18 would reduce the number of calls to overlap and eliminate calls to adjacent, but I don't think that's the critical issue by itself.)
comment:45 in reply to: ↑ 44 Changed at 2010-08-16T23:06:37Z by davidsarah
Replying to davidsarah:
Spans.add does a linear search (plus a sort, if there is no overlap, but Timsort takes linear time for an already-sorted array), so the overall complexity of DataSpans.get_spans is Θ(n2) where n is the number of spans.
Since Spans uses essentially the same invariant as DataSpans for its array of spans (they are sorted with no overlaps or adjacency), it is possible to implement get_spans in Θ(1) time. However I suspect that the important difference here is between Θ(n2) and Θ(n).
Note that, given this problem and Brian's observations in comment:43, the overall time for a download will be Θ(n3). So maybe we do need a better data structure (some sort of balanced tree or heap, maybe) if we want to get to Θ(n log n) rather than Θ(n2) for the whole download. But maybe that can wait until after releasing 1.8.
(Actually, just logging the output of Spans.dump calls will by itself cause Θ(n2) behaviour for the whole download, although with a fairly small constant.)
comment:46 in reply to: ↑ 43 Changed at 2010-08-17T05:19:10Z by zooko
Replying to warner:
- that said, I don't understand how assertions added to spans.py#L47 would ever fire. If those same assertions were added to spans.py#L295, I'd get it. What types were start/length in your observed assertion failures? And what was the stack trace?
This was my mistake. I must have confused it with a different test run. Those assertions never fire.
comment:47 Changed at 2010-08-18T12:57:33Z by zooko
run 111
1.8.0c2
requesting all of the file
with flog running
$ echo this is run 111 tahoe-lafs v1.8.0c2-r4699+ ; time curl http://localhost:3456/file/URI%3ACHK%3A4klgnafrwsm2nx3bqy24ygac5a%3Acrz7nhthi4bevzrug6xwgif2vhiacp7wk2cfmjutoz2ns3w45qza%3A3%3A10%3A1490710513/@@named=/bbb-360p24.i420.lossless.drc.ogg.fixed.ogg%2Bbbb-24fps.flac.via-ffmpeg.ogg  > bbb.ogg
this is run 111 tahoe-lafs v1.8.0c2-r4699+
  % Total    % Received % Xferd  Average Speed   Time    Time     Time  Current
                                 Dload  Upload   Total   Spent    Left  Speed
 27 1421M   27  394M    0     0  18995      0 21:47:59  6:02:29 15:45:30     0^C

real    362m29.965s
user    0m1.123s
sys     0m4.187s
comment:48 Changed at 2010-08-18T12:58:38Z by zooko
Oh, and in run 111 (comment:47) I had added log messages for all events which touched the Share._received Spans object so the resulting flogfile is a trace of everything that affects that object.
comment:49 Changed at 2010-08-18T14:07:45Z by zooko
The following run has patch attachment:spans.py.diff.
run 112
1.8.0c2
requesting all of the file
with flog running
$ echo this is run 112 tahoe-lafs v1.8.0c2-r4699+ ; time curl http://localhost:3456/file/URI%3ACHK%3A4klgnafrwsm2nx3bqy24ygac5a%3Acrz7nhthi4bevzrug6xwgif2vhiacp7wk2cfmjutoz2ns3w45qza%3A3%3A10%3A1490710513/@@named=/bbb-360p24.i420.lossless.drc.ogg.fixed.ogg%2Bbbb-24fps.flac.via-ffmpeg.ogg  > bbb.ogg
this is run 112 tahoe-lafs v1.8.0c2-r4699+
  % Total    % Received % Xferd  Average Speed   Time    Time     Time  Current
                                 Dload  Upload   Total   Spent    Left  Speed
 30 1421M   30  435M    0     0   113k      0  3:33:42  1:05:29  2:28:13  139k^C

real    65m29.907s
user    0m0.350s
sys     0m2.302s
comment:50 Changed at 2010-08-18T15:57:23Z by zooko
The patch helped a lot—compare run 112 to 111—but not enough to make trunk as fast as 1.7.1 on large downoads—compare run 112 to runs 102, 103, 105, and 109.
I intend to write a tool which reads the traces of what was done to the Share._received Spans object and does those operations to a Spans object so that we can run benchmark it and profile it in isolation.
| run | version | downloaded | download KBps | flags |
|---|---|---|---|---|
| 101 | 1.8.0c2 | 100 MB | 91 | |
| 102 | 1.7.1 | 100 MB | 182 | |
| 103 | 1.7.1 | 100 MB | 207 | |
| 104 | 1.8.0c2 | 100 MB | 82 | |
| 105 | 1.7.1 | 100 MB | 211 | |
| 109 | 1.7.1 | 100 MB | 228 | cProfile |
| 110 | 1.8.0c2 | 100 MB | 113 | cProfile |
| 111 | 1.8.0c2 | 413 MB | 19 | spanstrace |
| 112 | 1.8.0c2 | 456 MB | 113 | spanstrace, patched |
Changed at 2010-08-18T15:58:51Z by zooko
Changed at 2010-08-18T16:01:33Z by zooko
Changed at 2010-08-18T16:03:04Z by zooko
comment:51 Changed at 2010-08-18T16:04:20Z by zooko
attachment:debuggery-trace-spans.dpatch.txt adds logging of all events that touched Share._received at loglevel CURIOUS. attachment:run-111-above28-flog.pickle.bz2 and attachment:run-112-above28-flog.pickle.bz2 are the flogs from run 111 and run 112 with only events logged at level CURIOUS or above.
comment:52 Changed at 2010-08-18T17:02:52Z by zooko
| run | version | downloaded | download KBps | flags |
|---|---|---|---|---|
| 113 | 1.7.1 | 543 MB | 241 | on office network |
$ echo this is run 113 tahoe-lafs v1.7.1 ; time curl http://localhost:3456/file/URI%3ACHK%3A4klgnafrwsm2nx3bqy24ygac5a%3Acrz7nhthi4bevzrug6xwgif2vhiacp7wk2cfmjutoz2ns3w45qza%3A3%3A10%3A1490710513/@@named=/bbb-360p24.i420.lossless.drc.ogg.fixed.ogg%2Bbbb-24fps.flac.via-ffmpeg.ogg  > bbb.ogg
this is run 113 tahoe-lafs v1.7.1
  % Total    % Received % Xferd  Average Speed   Time    Time     Time  Current
                                 Dload  Upload   Total   Spent    Left  Speed
 36 1421M   36  518M    0     0   241k      0  1:40:26  0:36:37  1:03:49  257k^C

real    36m39.238s
user    0m0.329s
sys     0m2.733s
comment:53 Changed at 2010-08-18T18:56:04Z by warner
BTW, be sure to pay attention to the DataSpans too, specifically Share._received . That's the one that I observed growing linearly with number-of-segments-read.
I'm close to finishing my rework of the way Shares are handled. If we can make new-downloader fast enough by fixing complexity issues in spans.py, we should stick with that for 1.8.0, because those are probably smaller and less intrusive changes. If not, here are the properties of my Share-handling changes:
- use a new diversity-seeking Share selection algorithm, as described in comment:27 . This should distribute the download load evenly among all known servers when they have equal number of shares, and as evenly as possible (while still getting k shares) when not. If more shares are discovered later, the algorithm will recalculate the sharemap and take advantage of the new shares, and we'll keep looking for new shares as long as we don't have the diversity that we want (one share per server).
- fix the problem in which late shares (not used for the first segment, but located and added later) were not given the right sized hashtree and threw errors, causing them to be dropped. I think this completely broke the "tolerate loss of servers" feature, but the problem might have been caused by the diversity-seeking algorithm change, rather than something that was in new-downloader originally.
- deliver all shares to the SegmentFetcher as soon as we learn about them, instead of waiting for the fetcher to tell us it's hungry. This gives the fetcher more information to work with.
I might be able to attach a patch tomorrow.. there are still some bugs in it, and I haven't finished implementing the last point (push shares on discovery, not pull on hunger).
comment:54 Changed at 2010-08-18T23:38:51Z by warner
Oh, hey, here's a simple patch to try out:
diff --git a/src/allmydata/immutable/downloader/share.py b/src/allmydata/immutable/downloader/share.py
index f7ed4e8..413f907 100644
--- a/src/allmydata/immutable/downloader/share.py
+++ b/src/allmydata/immutable/downloader/share.py
@@ -531,6 +531,9 @@ class Share:
             for o in observers:
                 # goes to SegmentFetcher._block_request_activity
                 o.notify(state=COMPLETE, block=block)
+            # now clear our received data, to dodge the #1170 spans.py
+            # complexity bug
+            self._received = DataSpans()
         except (BadHashError, NotEnoughHashesError), e:
             # rats, we have a corrupt block. Notify our clients that they
             # need to look elsewhere, and advise the server. Unlike
Since self._received is supposed to be empty after each segment is complete (unless we guess the segsize wrong), this patch simply manually empties it at that point. No data is retained from one segment to the next: any mistakes will just cause us to ask for more data next time.
If the problem in this bug is a computational complexity in DataSpans, this should bypass it, by making sure we never add more than 3 or 4 ranges to one, since even O(n^3) is small when n is only 3 or 4. (we should still fix the problem, but maybe the fix can wait for 1.8.1). If the problem is in Spans, or elsewhere, then this won't help.
Changed at 2010-08-19T02:26:36Z by zooko
comment:55 follow-up: ↓ 56 Changed at 2010-08-19T02:31:18Z by zooko
attachment:run-112-above28-flog-dump-sh8-on-nsziz.txt is a flogtool dump of attachment:attachment:run-112-above28-flog.pickle.bz2 grepped for just one particular share (sh8 on nsziz). It is suitable as the input file for misc/simulators/bench_spans.py.
comment:56 in reply to: ↑ 55 Changed at 2010-08-19T02:31:47Z by zooko
attachment:run-112-above28-flog-dump-sh8-on-nsziz.txt is a flogtool dump of attachment:run-112-above28-flog.pickle.bz2 grepped for just one particular share (sh8 on nsziz). It is suitable as the input file for misc/simulators/bench_spans.py.
The output that I get on my Macbook Pro is:
MAIN Zooko-Ofsimplegeos-MacBook-Pro:~/playground/tahoe-lafs/trunk$ PYTHONPATH=~/playground/tahoe-lafs/trunk/support/lib/python2.6/site-packages/ python  ~/playground/tahoe-lafs/trunk/misc/simulators/bench_spans.py ~/Public/Drop\ Box/run-112-above28-flog-dump-sh8-on-nsziz.txt
all results are in time units per N
time units per second: 1000000; seconds per time unit: 0.000001
(microseconds)
    600 best: 2.265e+01,   3th-best: 2.402e+01, mean: 2.462e+01,   3th-worst: 2.502e+01, worst: 2.585e+01 (of     10)
   6000 best: 1.069e+02,   3th-best: 1.119e+02, mean: 1.137e+02,   3th-worst: 1.149e+02, worst: 1.201e+02 (of     10)
  60000 best: 2.916e+01,   1th-best: 2.916e+01, mean: 5.080e+02,   1th-worst: 9.868e+02, worst: 9.868e+02 (of      2)
This is even though I have attachment:spans.py.diff applied.
comment:57 Changed at 2010-08-19T04:27:20Z by zooko
Okay, the patch from comment:54 seems to have improved performance significantly. I just performed run 114:
MUSI Zooko-Ofsimplegeos-MacBook-Pro:~/Desktop$ echo this is run 114 tahoe-lafs v1.8.0c2-r4699+comment:54 ; time curl http://localhost:3456/file/URI%3ACHK%3A4klgnafrwsm2nx3bqy24ygac5a%3Acrz7nhthi4bevzrug6xwgif2vhiacp7wk2cfmjutoz2ns3w45qza%3A3%3A10%3A1490710513/@@named=/bbb-360p24.i420.lossless.drc.ogg.fixed.ogg%2Bbbb-24fps.flac.via-ffmpeg.ogg  > bbb.ogg
this is run 114 tahoe-lafs v1.8.0c2-r4699+comment:54
  % Total    % Received % Xferd  Average Speed   Time    Time     Time  Current
                                 Dload  Upload   Total   Spent    Left  Speed
 10 1421M   10  146M    0     0   149k      0  2:42:42  0:16:42  2:26:00  159k^R
 30 1421M   30  435M    0     0   147k      0  2:44:53  0:50:30  1:54:23  144k^C

real    50m30.207s
user    0m0.290s
sys     0m2.112s
Here is the full table:
| run | version | downloaded | download KBps | flags |
|---|---|---|---|---|
| 101 | 1.8.0c2 | 100 MB | 91 | |
| 102 | 1.7.1 | 100 MB | 182 | |
| 103 | 1.7.1 | 100 MB | 207 | |
| 104 | 1.8.0c2 | 100 MB | 82 | |
| 105 | 1.7.1 | 100 MB | 211 | |
| 109 | 1.7.1 | 100 MB | 228 | cProfile |
| 110 | 1.8.0c2 | 100 MB | 113 | cProfile |
| 111 | 1.8.0c2 | 413 MB | 19 | spanstrace |
| 112 | 1.8.0c2 | 456 MB | 113 | spanstrace, spans.py.diff |
| 113 | 1.7.1 | 543 MB | 241 | on office network |
| 114 | 1.8.0c2 | 456 MB | 147 | spans.py.diff + comment:54 |
I'm not sure if v1.8.0c2 is now good enough to be considered "not a significant regression" vs. v1.7.1 for downloading large files. I'll go download a large file with v1.7.1 now on my home network for comparison...
comment:58 Changed at 2010-08-19T05:07:19Z by zooko
Hm, it seems like v1.7.1 is still substantially faster than v1.8.0c2+comment:54:
| run | version | downloaded | download KBps | flags |
|---|---|---|---|---|
| 115 | 1.7.1 | 456 MB | 224 |
MUSI Zooko-Ofsimplegeos-MacBook-Pro:~/Desktop$ echo this is run 115 tahoe-lafs v1.7.1 ; time curl http://localhost:3456/file/URI%3ACHK%3A4klgnafrwsm2nx3bqy24ygac5a%3Acrz7nhthi4bevzrug6xwgif2vhiacp7wk2cfmjutoz2ns3w45qza%3A3%3A10%3A1490710513/@@named=/bbb-360p24.i420.lossless.drc.ogg.fixed.ogg%2Bbbb-24fps.flac.via-ffmpeg.ogg  > bbb.ogg
this is run 115 tahoe-lafs v1.7.1
  % Total    % Received % Xferd  Average Speed   Time    Time     Time  Current
                                 Dload  Upload   Total   Spent    Left  Speed
 30 1421M   30  435M    0     0   224k      0  1:48:09  0:33:06  1:15:03  240k^C

real    33m6.746s
user    0m0.287s
sys     0m2.307s
comment:59 Changed at 2010-08-19T05:44:58Z by zooko
Well the good news is that comment:54 fixes the problem that downloads go slower the bigger they are (as expected). The bad news is that even with comment:54 Tahoe-LAFS v1.8.0c2 is substantially slower than v1.7.1 for large files:
| run | version | downloaded | download KBps | flags |
|---|---|---|---|---|
| 116 | 1.8.0c2 | 314 MB | 154 | spans.py.diff + comment:54 |
MUSI Zooko-Ofsimplegeos-MacBook-Pro:~/Desktop$ echo this is run 115 tahoe-lafs v1.8.0c2+comment:54 ; time curl http://localhost:3456/file/URI%3ACHK%3A4klgnafrwsm2nx3bqy24ygac5a%3Acrz7nhthi4bevzrug6xwgif2vhiacp7wk2cfmjutoz2ns3w45qza%3A3%3A10%3A1490710513/@@named=/bbb-360p24.i420.lossless.drc.ogg.fixed.ogg%2Bbbb-24fps.flac.via-ffmpeg.ogg  > bbb.ogg
this is run 115 tahoe-lafs v1.8.0c2+comment:54
  % Total    % Received % Xferd  Average Speed   Time    Time     Time  Current
                                 Dload  Upload   Total   Spent    Left  Speed
 21 1421M   21  300M    0     0   154k      0  2:37:11  0:33:16  2:03:55  160k^C

real    33m16.529s
user    0m0.203s
sys     0m1.507s
I'm going to start another run with v1.8.0c2, this time with the cProfile tool running, and go to sleep.
Changed at 2010-08-19T06:01:17Z by zooko
comment:60 Changed at 2010-08-19T06:01:41Z by zooko
I ran 1.8.0c2 under the profiler for a few minutes and then stopped it in order to get the profiling stats (attached). Unfortunately, they do not show any more smoking gun of CPU usage, so the remaining slowdown from v1.7.1 to v1.8.0c2 is likely to be one of the network-scheduling issues that Brian has been thinking about (server selection, pipelining), or else some other sort of subtle timing issue...
Here are the profiling stats for a brief (~4 minute) run of 1.8.0c2:
MUSI Zooko-Ofsimplegeos-MacBook-Pro:~/Desktop$ echo this is run 117 tahoe-lafs v1.8.0c2+comment:54 cProfile ; time curl http://localhost:3456/file/URI%3ACHK%3A4klgnafrwsm2nx3bqy24ygac5a%3Acrz7nhthi4bevzrug6xwgif2vhiacp7wk2cfmjutoz2ns3w45qza%3A3%3A10%3A1490710513/@@named=/bbb-360p24.i420.lossless.drc.ogg.fixed.ogg%2Bbbb-24fps.flac.via-ffmpeg.ogg  > bbb.ogg
this is run 117 tahoe-lafs v1.8.0c2+comment:54 cProfile
  % Total    % Received % Xferd  Average Speed   Time    Time     Time  Current
                                 Dload  Upload   Total   Spent    Left  Speed
  2 1421M    2 35.1M    0     0   160k      0  2:30:45  0:03:43  2:27:02  169k^C

real    3m43.778s
user    0m0.027s
sys     0m0.210s
The functions with the most "cumtime" (time spent in the function or in any of the functions that it called) are:
        1    0.000    0.000  275.676  275.676 base.py:1156(run)
        1    0.175    0.175  275.675  275.675 base.py:1161(mainLoop)
    30070    0.576    0.000  267.477    0.009 selectreactor.py:93(doSelect)
    30070  259.463    0.009  260.149    0.009 {select.select}
    30070    0.191    0.000    7.795    0.000 base.py:751(runUntilCurrent)
     3724    0.031    0.000    7.205    0.002 eventual.py:18(_turn)
    27682    0.300    0.000    6.634    0.000 log.py:71(callWithLogger)
    27682    0.242    0.000    6.297    0.000 log.py:66(callWithContext)
     3453    0.075    0.000    5.742    0.002 share.py:187(loop)
    27682    0.116    0.000    5.719    0.000 context.py:58(callWithContext)
    27682    0.199    0.000    5.587    0.000 context.py:32(callWithContext)
    27681    0.228    0.000    5.310    0.000 selectreactor.py:144(_doReadOrWrite)
     3453    0.089    0.000    5.299    0.002 share.py:238(_do_loop)
    26522    0.347    0.000    4.397    0.000 tcp.py:443(doRead)
    26506    0.306    0.000    4.376    0.000 tcp.py:114(doRead)
28407/17703    0.257    0.000    3.770    0.000 defer.py:453(_runCallbacks)
13880/11193    0.031    0.000    2.824    0.000 defer.py:338(callback)
13983/11295    0.031    0.000    2.795    0.000 defer.py:433(_startRunCallbacks)
3064/3052    0.014    0.000    2.658    0.001 defer.py:108(maybeDeferred)
     3453    0.092    0.000    2.654    0.001 share.py:701(_send_requests)
     2639    0.007    0.000    2.032    0.001 referenceable.py:406(callRemote)
     2608    0.034    0.000    2.025    0.001 banana.py:633(dataReceived)
     2639    0.052    0.000    2.012    0.001 referenceable.py:418(_callRemote)
     2604    0.005    0.000    2.009    0.001 share.py:733(_send_request)
     2608    0.344    0.000    1.988    0.001 banana.py:701(handleData)
     2640    0.008    0.000    1.791    0.001 banana.py:183(send)
     2640    0.021    0.000    1.783    0.001 root.py:92(send)
     2651    0.199    0.000    1.683    0.001 banana.py:191(produce)
    26506    1.680    0.000    1.680    0.000 {built-in method recv}
28693/25918    0.072    0.000    1.651    0.000 defer.py:266(addCallbacks)
     4299    0.044    0.000    1.494    0.000 share.py:267(_get_satisfaction)
    12418    0.125    0.000    1.052    0.000 hashtree.py:298(needed_hashes)
I'll go ahead and leave a download running under the profiler overnight just in case something turns up.
Changed at 2010-08-19T06:04:37Z by zooko
Changed at 2010-08-19T06:06:35Z by zooko
comment:61 follow-up: ↓ 67 Changed at 2010-08-19T06:11:10Z by zooko
If you wanted to investigate why 1.8.0c2 is so much slower than 1.7.1 at downloading a large file even after applying the comment:54 patch, then you could use attachment:run-115-flog.pickle.bz2 and attachment:run-116-flog.pickle.bz2 as evidence. Hm, hey waitasecond, in my earlier testing (recorded in this ticket), 1.8.0c2 was faster then 1.7.1 for small files (<= 10 MB). This was also the case for Nathan Eisenberg's benchmarks (posted to tahoe-dev). But currently it looks to me like the average download speed (as reported by curl during its operation) is the same at the beginning of the download as at the end, i.e. even during the first 10 MB or so 1.8.0c2 is only getting about 150 KBps where 1.7.1 is getting more than 200 KBps. Did something change?
I guess I (or someone) should run 1.7.1 vs. 1.8.0c2+comment:54 on 10 MB files. But I'm way too tired to start that again right now.
Man, I'm really worn out from staying up night after night poking at this and then having to get up early the next morning to help my children get ready for school and myself ready for work. I could use more help!
comment:62 follow-up: ↓ 63 Changed at 2010-08-19T06:44:51Z by davidsarah
Perhaps the remaining issue is server selection. Let's try Brian's comment:27 diversity-seeking algorithm, combined with the comment:54 fix.
comment:63 in reply to: ↑ 62 Changed at 2010-08-19T14:07:15Z by zooko
Replying to davidsarah:
Perhaps the remaining issue is server selection. Let's try Brian's comment:27 diversity-seeking algorithm, combined with the comment:54 fix.
I'm willing to try the comment:27 diversity-seeking algorithm, but I also would like to verify whether or not server-selection is one of the factors by inspecting the flogs...
comment:64 Changed at 2010-08-19T14:10:46Z by zooko
Yes, the overnight run yielded no smoking gun (smoking CPU?) that I can see. I'll attach the full profiling results as an attachment.
MUSI Zooko-Ofsimplegeos-MacBook-Pro:~/Desktop$ echo this is run 118 tahoe-lafs v1.8.0c2+comment:54 cProfile ; time curl http://localhost:3456/file/URI%3ACHK%3A4klgnafrwsm2nx3bqy24ygac5a%3Acrz7nhthi4bevzrug6xwgif2vhiacp7wk2cfmjutoz2ns3w45qza%3A3%3A10%3A1490710513/@@named=/bbb-360p24.i420.lossless.drc.ogg.fixed.ogg%2Bbbb-24fps.flac.via-ffmpeg.ogg  > bbb.ogg
this is run 118 tahoe-lafs v1.8.0c2+comment:54 cProfile
  % Total    % Received % Xferd  Average Speed   Time    Time     Time  Current
                                 Dload  Upload   Total   Spent    Left  Speed
100 1421M  100 1421M    0     0   158k      0  2:32:39  2:32:39 --:--:--  168k

real    152m39.145s
user    0m1.024s
sys     0m7.661s
         275630510 function calls (274835891 primitive calls) in 28165.965 CPU seconds

   ncalls  tottime  percall  cumtime  percall filename:lineno(function)
        1    0.000    0.000 28165.965 28165.965 base.py:1156(run)
        1    8.156    8.156 28165.964 28165.964 base.py:1161(mainLoop)
  1226198   24.746    0.000 27834.397    0.023 selectreactor.py:93(doSelect)
  1226198 27531.442    0.022 27547.532    0.022 {select.select}
  1226198    8.846    0.000  313.488    0.000 base.py:751(runUntilCurrent)
   148051    1.222    0.000  285.941    0.002 eventual.py:18(_turn)
  1107126   12.628    0.000  257.892    0.000 log.py:71(callWithLogger)
  1107126   10.433    0.000  243.790    0.000 log.py:66(callWithContext)
   136521    3.020    0.000  229.335    0.002 share.py:187(loop)
  1107126    5.102    0.000  218.355    0.000 context.py:58(callWithContext)
  1107126    8.483    0.000  212.571    0.000 context.py:32(callWithContext)
   136521    1.831    0.000  211.328    0.002 share.py:238(_do_loop)
  1107126    9.274    0.000  200.718    0.000 selectreactor.py:144(_doReadOrWrite)
  1064200   13.055    0.000  178.141    0.000 tcp.py:114(doRead)
  1064262   15.145    0.000  165.679    0.000 tcp.py:443(doRead)
1100168/689294   10.315    0.000  135.808    0.000 defer.py:453(_runCallbacks)
536780/433736    1.023    0.000  110.261    0.000 defer.py:338(callback)
540512/437468    1.259    0.000  109.033    0.000 defer.py:433(_startRunCallbacks)
   136521    3.623    0.000  107.058    0.001 share.py:701(_send_requests)
118185/118168    0.513    0.000   94.733    0.001 defer.py:108(maybeDeferred)
   102399    0.197    0.000   81.560    0.001 share.py:733(_send_request)
   102514    0.290    0.000   81.467    0.001 referenceable.py:406(callRemote)
   102514    1.867    0.000   80.688    0.001 referenceable.py:418(_callRemote)
   104846    1.446    0.000   79.737    0.001 banana.py:633(dataReceived)
   104846   14.309    0.000   78.171    0.001 banana.py:701(handleData)
   102515    0.320    0.000   72.324    0.001 banana.py:183(send)
   102515    0.785    0.000   72.004    0.001 root.py:92(send)
  1064200   70.123    0.000   70.123    0.000 {built-in method recv}
   102562    7.417    0.000   68.190    0.001 banana.py:191(produce)
   170643    1.742    0.000   60.005    0.000 share.py:267(_get_satisfaction)
1114150/1011232    2.898    0.000   50.939    0.000 defer.py:266(addCallbacks)
   494839    5.175    0.000   42.363    0.000 hashtree.py:298(needed_hashes)
  4010897    6.757    0.000   41.319    0.000 tcp.py:413(write)
   494839    6.477    0.000   37.139    0.000 hashtree.py:128(needed_for)
  4010897   18.303    0.000   34.562    0.000 abstract.py:177(write)
   102809    1.151    0.000   33.768    0.000 banana.py:1049(handleClose)
   136521    2.571    0.000   33.606    0.000 share.py:556(_desire)
    45498    0.163    0.000   32.926    0.001 hashutil.py:51(tagged_hash)
    45499    0.083    0.000   32.782    0.001 fetcher.py:83(loop)
  1230099    3.737    0.000   32.762    0.000 banana.py:22(int2b128)
    45499    0.451    0.000   32.699    0.001 fetcher.py:91(_do_loop)
   227571    0.386    0.000   31.989    0.000 hashutil.py:31(update)
   102514    1.152    0.000   31.951    0.000 call.py:652(receiveClose)
   227571   31.557    0.000   31.557    0.000 {method 'update' of '_sha256.SHA256' objects}
Changed at 2010-08-19T14:11:27Z by zooko
Changed at 2010-08-19T17:27:57Z by warner
patch to prefer share diversity, forget leftover data after each segment, and fix handling of numsegs
comment:65 Changed at 2010-08-19T17:29:47Z by warner
the "1170-combo.diff" patch combines the approaches as suggested in comment:62 . Please give it a try and see if it helps. I'll try to look at the flogs to see what servers were used, to see if that run has a diversity issue or not.
comment:66 Changed at 2010-08-19T18:27:51Z by zooko
Okay, I investigated server selection on the bus to work this morning. attachment:run-115-flog.pickle.bz2 shows:
22:10:56.877 [649]: <CiphertextDownloader #1>(u6h6p4mlr3j7): starting download
22:10:56.881 [650]: sending DYHB to [tavrk54e]
22:10:56.882 [651]: sending DYHB to [xflgj7cg]
22:10:56.883 [652]: sending DYHB to [sp26qyqc]
22:10:56.884 [653]: sending DYHB to [zkj6swl2]
22:10:56.885 [654]: sending DYHB to [sroojqcx]
22:10:56.886 [655]: sending DYHB to [4rk5oqd7]
22:10:56.887 [656]: sending DYHB to [nszizgf5]
22:10:56.887 [657]: sending DYHB to [62nlabgf]
22:10:56.888 [658]: sending DYHB to [fp3xjndg]
22:10:56.888 [659]: sending DYHB to [rpiw4n3f]
22:10:57.006 [660]: got results from [xflgj7cg]: shnums []
22:10:57.010 [661]: got results from [rpiw4n3f]: shnums []
22:10:57.017 [662]: got results from [62nlabgf]: shnums []
22:10:57.058 [663]: got results from [nszizgf5]: shnums [3, 7, 8]
22:10:57.066 [664]: got results from [4rk5oqd7]: shnums [2]
22:10:57.110 [665]: got results from [fp3xjndg]: shnums [4, 9]
22:10:57.126 [666]: got results from [tavrk54e]: shnums []
22:10:57.181 [667]: got results from [zkj6swl2]: shnums []
22:10:57.205 [668]: got results from [sroojqcx]: shnums [1, 6]
22:10:57.474 [669]: got results from [sp26qyqc]: shnums [0, 5]
The 1.7.1 flog doesn't which servers are actually being used for Request Blocks, but we know that 1.7.1 will always choose to get all three shares from nszizgf5 in a case like this.
Therefore I don't think that 1.8's share-selection can be part of the explanation for why 1.8 is slower than 1.7.
(This doesn't mean that improved share selection wouldn't make 1.9 faster than 1.8 is now.)
comment:67 in reply to: ↑ 61 Changed at 2010-08-19T19:13:37Z by warner
Replying to zooko:
Hm, hey waitasecond, in my earlier testing (recorded in this ticket), 1.8.0c2 was faster then 1.7.1 for small files (<= 10 MB). This was also the case for Nathan Eisenberg's benchmarks (posted to tahoe-dev). But currently it looks to me like the average download speed (as reported by curl during its operation) is the same at the beginning of the download as at the end, i.e. even during the first 10 MB or so 1.8.0c2 is only getting about 150 KBps where 1.7.1 is getting more than 200 KBps. Did something change?
There's a sizeable startup time in 1.7.1 (lots of roundtrips), which went away in 1.8.0c2 . I think we're all in agreement about the small-file speedups that provides (i.e. we've not seen any evidence to the contrary). The change is on the order of a few seconds, though, so I think a 10MB file (or portion of a file) that takes 10MB/150kBps= 60s to complete won't be affected very much. I don't think you'll be able to see its effects in the curl output.
Nathan's tests were on hundreds or thousands of small files.
From my tests, the new-downloader sees about 500ms more taken to complete the first segment than the second and following ones. I believe that's the time spend doing server selection, UEB fetches, and the large hash chain fetches.
Changed at 2010-08-20T00:07:51Z by zooko
I ran three more measurements today at the office -- runs 119, 120, and 121 . These are the curl stdout from those. I will update a table with these results and put it into the original opening comment of this ticket.
comment:68 Changed at 2010-08-20T00:13:38Z by zooko
- Description modified (diff)
Changed at 2010-08-20T16:31:25Z by zooko
I ran several more measurements from home, intended to test whether the logging in new-downloader is partially responsible for new-downloader's slowness. These are the curl stdout from those runs. I will update the table in the opening comment of this ticket to include these runs.
Changed at 2010-08-20T16:35:42Z by zooko
comment:69 Changed at 2010-08-20T16:43:19Z by zooko
- Description modified (diff)
comment:70 Changed at 2010-08-20T16:45:39Z by zooko
Brian: I updated the table in the initial comment. Please let me know what other sorts of measurements you would like from me. It looks to me like there is still a significant regression in 1.8.0c2+comment:54+spans.py.diff even if I comment-out almost all calls to log.msg() in immutable/download/*.py. I will attach the patch that I used to comment out all those logging calls. I'll probably go ahead and apply your attachment:1170-combo.diff and run 100 MB downloads from the office during work today.
Changed at 2010-08-20T16:46:42Z by zooko
comment:71 Changed at 2010-08-20T21:59:18Z by warner
I did a quick test at home with a def msg(*args,**kwargs):pass in src/allmydata/util/log.py, and didn't see a noticable change (the noise level was pretty high, so even if there were a 10% difference, I probably wouldn't have been able to spot it).
In some other testing at work, I was unable to see a consistent performance difference between 171 and my comment:65 combo-patch, but the speed was warbling all over the place, so I don't feel that it was a very conclusive run. I'd patched both to only use a single server (nszi?), to reduce the variables.
What I'd like to do is to run a series of tests from my home network (no other traffic) using my personal backupgrid server (no other traffic), to see how consistent the results are. Maybe tomorrow I'll get a chance to try that.
Changed at 2010-08-21T00:44:05Z by zooko
I ran several more measurements from the office, intended to test whether Brian's attachment:1170-combo.diff made 1.8.0c2 competitive with 1.7.1. Sadly it appears not. :-( I'll update the table in the initial comment with these results.
Changed at 2010-08-21T00:47:15Z by zooko
I ran several more measurements from the office, intended to test whether Brian's attachment:1170-combo.diff made 1.8.0c2 competitive with 1.7.1. Sadly it appears not. :-( I'll update the table in the initial comment with these results. This attachment is a better-named copy of attachment:perf-measure-office.txt .
Changed at 2010-08-21T00:48:33Z by zooko
comment:72 Changed at 2010-08-21T00:59:01Z by zooko
- Description modified (diff)
comment:73 Changed at 2010-08-21T01:04:51Z by zooko
Brian: please inspect the table in the ticket initial comment. It seems like there is a bimodal distribution with 1170-combo.diff, half of the time it runs at about 179 or 180 KBps (it ran at 169 KBps for the large download) and the other half of the time it runs at 262–291 KBps. The latter range is slightly faster than 1.7.1! I attached the down-status.html for the long download that ran at 169 KBps: run139-down-status.html.bz2.
comment:74 Changed at 2010-08-21T01:33:57Z by davidsarah
- Description modified (diff)
comment:75 Changed at 2010-08-21T01:48:56Z by davidsarah
- Description modified (diff)
comment:76 Changed at 2010-08-21T04:58:28Z by zooko
- Description modified (diff)
comment:77 Changed at 2010-08-21T05:06:59Z by zooko
- Description modified (diff)
Changed at 2010-08-21T17:05:52Z by terrell
comment:78 Changed at 2010-08-21T17:22:30Z by terrell
- Description modified (diff)
and run 142
[11:37:28:trel:~/Desktop/tahoestuff/trunkpatched] time curl --range 0-100000000 http://localhost:3456/file/URI%3ACHK%3A4klgnafrwsm2nx3bqy24ygac5a%3Acrz7nhthi4bevzrug6xwgif2vhiacp7wk2cfmjutoz2ns3w45qza%3A3%3A10%3A1490710513/@@named=/bbb-360p24.i420.lossless.drc.ogg.fixed.ogg%2Bbbb-24fps.flac.via-ffmpeg.ogg  > bbb-100M.ogg
 % Total    % Received % Xferd  Average Speed   Time    Time     Time  Current
                                 Dload  Upload   Total   Spent    Left  Speed
100 95.3M  100 95.3M    0     0   215k      0  0:07:32  0:07:32 --:--:--  182k

real	7m32.860s
user	0m0.107s
sys	0m0.765s
Changed at 2010-08-21T18:17:35Z by zooko
Changed at 2010-08-21T18:40:29Z by zooko
comment:79 Changed at 2010-08-21T19:32:33Z by zooko
run-zooko1000 was from my local coffeeshop—Caffe Sole in South Boulder—and the status.html shows this interesting pattern that the downloader immediately issued 10 DYHB queries (as expected), and then it took 9.6 seconds for the first DYHB response to arrive. Then the really weird, part, it took 8.4s more for the next seven DYHB responses to arrive (totalling 18s from request to response)! Then, still weird, it took a total request-to-response time of 6 minutes for the ninth response and a total of 8 minutes for the tenth. Also, as soon as the first response arrived the downloader issued a new DYHB request, and that one, the eleventh one, took 8.92s for the response to arrive.
So, I suppose there is something very messed up about the network at my local coffeeshop. Perhaps it blocks a flow that starts on an idle TCP connection while it is trying to figure out how to insert ads into any HTTP responses, or something. Note that these TCP connections were all already established long before the download began.
Take-aways?
I guess it is that we should not make assumptions about "reasonable" for IP traffic. That is: if we want to support people who use Tahoe-LAFS from coffeeshops, over tethered cell phones, at Burning Man, on satellite uplinks, on the International Space Station, etc. (which I do).
Another take-away is that 1.8.0c2+combo.diff did pretty well in this situation! (I think 1.7.1 probably would have done well too but I didn't get a chance to try it.)
comment:80 Changed at 2010-08-21T20:13:33Z by terrell
- Description modified (diff)
Changed at 2010-08-22T04:41:52Z by terrell
capture from stdout - alternating between 1.7.1 and trunk+combo - run from cable modem at home on pubgrid
Changed at 2010-08-22T04:42:42Z by terrell
Changed at 2010-08-22T04:42:56Z by terrell
Changed at 2010-08-22T04:43:12Z by terrell
Changed at 2010-08-22T04:43:24Z by terrell
Changed at 2010-08-22T04:43:39Z by terrell
Changed at 2010-08-22T04:43:57Z by terrell
Changed at 2010-08-22T04:44:11Z by terrell
Changed at 2010-08-22T04:44:29Z by terrell
Changed at 2010-08-22T04:44:43Z by terrell
Changed at 2010-08-22T04:44:57Z by terrell
comment:81 Changed at 2010-08-22T04:57:54Z by terrell
- Description modified (diff)
runs 143-162 generated with the following bash script to alternate the clients and grab the status file:
feel free to adapt and reuse.
#!/bin/bash
##################################
# EDIT THESE VARIABLES
##################################
FIRSTRUN=143
RUNS=20
FILESIZE=100000000
BASE171="/Users/trel/Desktop/tahoestuff/allmydata-tahoe-1.7.1"
BASEPATCH="/Users/trel/Desktop/tahoestuff/trunkpatched"
CACHEDIR="/Users/trel/.tahoe/private/cache/download"
FILENAME="http://localhost:3456/file/URI%3ACHK%3A4klgnafrwsm2nx3bqy24ygac5a%3Acrz7nhthi4bevzrug6xwgif2vhiacp7wk2cfmjutoz2ns3w45qza%3A3%3A10%3A1490710513/@@named=/bbb-360p24.i420.lossless.drc.ogg.fixed.ogg%2Bbbb-24fps.flac.via-ffmpeg.ogg"
SAVEFILE="deleteme.ogg"
##################################
RUNTOTAL=$FIRSTRUN
RUNCOUNT=0
while [ $RUNCOUNT -lt $RUNS ]; do
  let RUNTOTAL=FIRSTRUN+RUNCOUNT
  echo "-----------------------------------------------"
  echo "RUN $RUNTOTAL"
  if [ $[$RUNTOTAL % 2] -eq 0 ]
  then
    cd $BASE171
  else
    cd $BASEPATCH
  fi
  pwd
  bin/tahoe --version
  bin/tahoe stop
  bin/tahoe start
  echo "waiting 10s for node to spin up and connect..."
  sleep 10
  echo "curl --range 0-$FILESIZE $FILENAME > $SAVEFILE"
  time curl --range 0-$FILESIZE $FILENAME > $SAVEFILE
  if [ `pwd` = $BASEPATCH ]
  then
    echo "saving status.html..."
    curl http://localhost:3456/status/down-0 > status-$RUNTOTAL.html
    bzip2 status-$RUNTOTAL.html
  fi
  rm -f $CACHEDIR/*
  rm $SAVEFILE
  let RUNCOUNT=RUNCOUNT+1
  sleep 1
done
comment:82 Changed at 2010-08-23T07:33:54Z by warner
- Description modified (diff)
I looked at the status.html files for some of the new-downloader runs. It looks like there's a reasonable correlation between download speed and server selection. The 240kBps-ish downloads tend to use sp26/nszi/4rk5, while the 130-140ish downloads tend to use fp3x or sroo instead of 4rk5.
Without more info from the 1.7.1 downloads (data which would be in the download-status, but for the old-downloader it isn't displayed until after the whole download is complete), we can't guess what servers were used for those runs. Zooko, how consistent do you think the speed-difference results would be if you used a 100MB file, instead of using the first 100MB of a multi-GB file? That might let us use Terrell's script and also collect download-status from the 1.7.1 runs.
It'd be awfully convenient if the speed difference that Zooko observed could be attributable to server selection, and if the combo patch made that selection work well enough to ship 1.8.0. A 1.8.1-era improvement could be to try out new servers over the course of the download, so that we'd land in the three-good-servers (sp26/nszi/4rk5) mode more often than the two-good-one-slow-servers (sp26/nszi/fp3x) mode.
Changed at 2010-08-23T07:50:25Z by warner
patch to add server-selection data to logs/twistd.log for 1.7.1
Changed at 2010-08-24T07:20:56Z by zooko
Changed at 2010-08-24T07:24:40Z by zooko
Changed at 2010-08-24T08:47:37Z by zooko
Changed at 2010-08-24T08:48:10Z by zooko
Changed at 2010-08-24T08:48:54Z by zooko
Changed at 2010-08-24T08:53:07Z by zooko
comment:83 Changed at 2010-08-24T09:17:21Z by zooko
- Description modified (diff)
comment:84 Changed at 2010-08-24T09:19:58Z by zooko
I added run1001 and run1002 to the big table. These two runs are notable for having complete packet traces and a screenshot of their wireshark summaries, as well as flogs and (for the 1.8.0c2 one) status.html. It looks to me as if 1.8.0c2+1170-combo.diff was slower than 1.7.1 for those runs because it chose slower servers.
Changed at 2010-08-24T09:23:42Z by zooko
Changed at 2010-08-24T09:25:59Z by zooko
Changed at 2010-08-24T09:28:34Z by zooko
Changed at 2010-08-24T09:33:24Z by zooko
Changed at 2010-08-24T09:35:43Z by zooko
Changed at 2010-08-24T09:37:44Z by zooko
Changed at 2010-08-24T09:40:42Z by zooko
Changed at 2010-08-24T09:41:59Z by zooko
Changed at 2010-08-24T09:42:39Z by zooko
Changed at 2010-08-24T09:45:49Z by zooko
Changed at 2010-08-24T09:46:30Z by zooko
Changed at 2010-08-24T09:46:40Z by zooko
comment:85 Changed at 2010-08-24T10:00:09Z by zooko
- Description modified (diff)
Added runs zooko2000 through zooko2019. Thanks a lot to Terrell for the script in comment:81 which I used to do these runs!
Comments: it looks like there really is a substantial slowdown for switching from v1.7.1 to v1.8.0+1170-combo.diff for this file on this grid. I started examining the status.html files in order to annotate which servers were used by 1.8.0c2+combo.diff, but I got tired and stopped doing it after run 2007. I think Brian's current hypothesis is that server selection is the most important factor, and that seems quite plausible to me. v1.7.1 used the same set of servers in every one of its runs, and its performance was more consistent than 1.8.0c2+combo.diff's was.
It has taken a lot of effort to generate this data and to attach it and format it, so I hope it helps! Thanks again to Terrell.
Now I'm starting a new experiment, downloading http://localhost:3456/file/URI%3ACHK%3Avpk5d6pl5qelhnwfwtjj2v7tmq%3Adkt453pu5le7qmtix55hiibrzqqq3euchcjguio6vbetobxw5ola%3A3%3A10%3A334400401/@@named=/Negativeland_on_Radio1190.org.ogg in its 300 MB entirety. This file currently has the following share layout:
Share ID  Nickname          Node ID
2	  FreeStorm-Neptune fp3xjndgjt2npubdl2jqqb26clanyag7
3	  strato            tavrk54ewt2bl2faybb55wrs3ghissvx
7	  FreeStorm-Neptune fp3xjndgjt2npubdl2jqqb26clanyag7
8	  strato            tavrk54ewt2bl2faybb55wrs3ghissvx
comment:86 Changed at 2010-08-24T16:00:13Z by zooko
- Description modified (diff)
comment:87 Changed at 2010-08-24T16:00:37Z by zooko
Finished annotating the big table with what servers were used for each download.
Changed at 2010-08-24T16:05:06Z by zooko
Changed at 2010-08-24T16:05:18Z by zooko
Changed at 2010-08-24T16:05:27Z by zooko
Changed at 2010-08-24T16:05:56Z by zooko
Changed at 2010-08-24T16:08:09Z by zooko
comment:88 Changed at 2010-08-24T16:13:48Z by zooko
- Description modified (diff)
comment:89 Changed at 2010-08-24T16:17:02Z by zooko
Added runs zooko3000, 3001, and 3002 to the table. These are, as mentioned, downloads of a 333 MB negativland.ogg file of which there are only 4 surviving shares, 2 shares each on fp3x and tavr. Run 3001 with v1.8.0c2+combo.diff went about half as fast as run 3000 with v1.7.1 even though they chose the same servers (for the long haul -- v1.8.0c2 uses different servers for the first segment or two I think). Then run 3002 started, with v1.7.1, and it went less than half as fast as run 3001 had! I had to stop it before it completed so I could go to work. I suspect that my DSL service was misbehaving at that time, but I haven't tried to confirm that, e.g. by examining the attached logs to see if there is some other explanation for why run 3002 went so slowly.
Changed at 2010-08-24T17:45:36Z by warner
timeline of 1.8.0c2 (no patches) download, local testgrid (one computer), shows share-selection misbehavior
Changed at 2010-08-24T17:46:05Z by warner
timeline of 1.8.0c2 (no patches) download, local testgrid (one computer), shows post-receive stall
comment:90 Changed at 2010-08-24T18:09:39Z by warner
I made a lot of progress with my javascript-based download-status visualization tools last night, after switching to the Protovis library (which rocks!). Here are two diagrams of a 12MB download performed on my laptop (using a local testgrid entirely contained on one computer: lots of bandwidth, but only one CPU to share among them all, and only one disk). The downloader code is from current trunk, which means 1.8.0c2 (it was not using any of the patches from this ticket, so it exhibits all the misbehaviors of 1.8.0c2).
I'm still working on the graphics. Time proceeds from left to right. The live display is pan+zoomable. Currently DYHB and block-reads are filled with a color that indicates which server they used, and block-reads get an outline color that indicates which share number was being accessed. Overlapping block-reads are shown stacked up. Most block reads are tiny (32 or 64 bytes) but of course each segment requires 'k' large reads (each of about 41kB, segsize/k).
- attachment:180c2-viz-dyhb.png : this shows the startup phase. Note how all block reads are coming from a single server (w5gi, in purple), even though we heard from other servers by the time the second segment started. Also note that, for some reason, the requests made for the first segment were all serialized by shnum: we waited for all requests from the first share to return before sending any requests for the second share.
- attachment:180c2-viz-delays.png : this shows the midpoint of the download (specifically the segments that cross the middle of the Merkle tree, requiring the most hash nodes to retrieve). By this point, I'd added a thicker outline around block reads that fetched more than 1kB of data, so the actual data blocks can be distinguished from the hash tree nodes. The reads are properly pipelined. But note the large gap (about 7.5ms) between the receipt of the last block and the delivery of the segment. Also note how the segments that require fewer hash nodes are delivered much faster.
I haven't yet ported these tools to the combo-patch -fixed downloader, nor have I applied them to a download from the testgrid (which would behave very differently: longer latencies, but less contention for disk or CPU). I'm partially inclined to disregard the idiosyncrasies displayed by these charts until I do that, but they still represent interesting problems to understand further.
The large delay on the lots-of-hash-nodes segments raises suspicions of bad performance in IncompleteHashTree when you add nodes, or about the behavior of DataSpans when you add/remove data in it. The DataSpans.add time occurs immediately after the response comes back, so is clearly minimal (it lives in the space between one response and the next, along the steep downwards slope), but the DataSpans.pop occurs during the mysterious gap. The Foolscap receive-processing time occurs inside the request block rectangle. The Foolscap transmit-serialization time occurs during the previous mysterious gap, so it must be fairly small (after the previous segment was delivered, we sent a bazillion hash requests, and the gap was small, whereas after the big segment was delivered, we didn't send any hash requests, and the gap was big).
The next set of information that will be useful to add here will we a generalized event list: in particular I want to see the start/finish times of all hashtree-manipulation calls, zfec-decode calls, and AES decrypt calls. That should take about 15 minutes to add, and should illuminate some of that gap.
comment:91 Changed at 2010-08-24T19:10:41Z by warner
in case anyone wants to play with it, attachment:viz-with-combo.diff.bz2 contains both the "combo patch" and my current Protovis-based visualization tool. From the download-status page, follow the "Timeline" link. Still kinda rough, but hopefully useful.
(wow, for reference, don't upload a 900kB diff file and then let Trac try to colorize it. Compress the diff first so that Trac doesn't get clever and time out.)
Changed at 2010-08-24T19:31:12Z by warner
patch with visualization tools and share-selection fix and Spans performance mitigation fix
comment:92 Changed at 2010-08-25T07:17:39Z by warner
I did some more testing with those visualization tools (adding some misc events like entry/exit of internal functions). I've found one place where the downloader makes excessive eventual-send calls which appears to cost 250us per remote_read call. I've also measured hash-tree operations as consuming a surprising amount of overhead.
- each Share._got_response call queues an eventual-send to Share.loop, which checks the satisfy/desire processes. Since a single TCP buffer is parsed into lots of Foolscap response messages, these are all queued during the same turn, which means the first loop() call will see all of the data, and the remaining ones will see nothing. Each of these empty loop() calls takes about 250us. There is one for each remote_read call, which means k*(3/2)*numsegs for the block hash trees and an additional k*(3/2)*numsegs for the ciphertext hash tree (because we ask each share for the CTHT nodes, rather than asking only one and hoping they return it so we can avoid an extra roundtrip). For k=3 that's 2.25ms per segment. The cost is variable: on some segments (in particular the first and middle ones) the overhead is maximal, whereas on every odd segnum there is no overhead. On a 12MB download, this is about 225ms, and on my local one-CPU testnet, the download took 2.9s, so this represents about 8%.
- It takes my laptop 1.34ms to process a set of blocks into a segment (seg2 of a 96-segment file). 1.19ms of that was checking the ciphertext hash tree (probably two extra hash nodes), and a mere 73us was spent in FEC. AES decryption of the segment took 1.1ms, and accounted for 65% of the 1.7ms inter-segment gap (the delay between delivering seg2 and requesting seg3).
I'd like to change the _got_response code to set a flag and queue a single call to loop instead of queueing multiple calls. That would save a little time (and probably remove the severe jitter that I've seen on local downloads), but I don't think it can explain the 50% slowdown that Zooko's observed.
These visualization tools are a lot of fun. One direction to explore is to record some packet timings (with tcpdump) and add it as an extra row: that would show us how much latency/load Foolscap is spending before it delivers a message response to the application.
I'll attach two samples of the viz output as attachment:viz-3.png and attachment:viz-4.png . The two captures are of different parts of the download, but in both cases the horizontal ticks are 500us apart. The candlestick-diagram-like shapes are the satisfy/desire sections of Share.loop, and the lines (actually very narrow boxes) between them are the "disappointment" calculation at the end of Share.loop, so the gap before it must be the send_requests routine.
Changed at 2010-08-25T07:18:48Z by warner
timeline sample showing satisfy/desire calls and process_block/FEC/hashtree operations
comment:93 Changed at 2010-08-25T15:02:26Z by warner
created #1186 to track the redundant Share.loop calls
Changed at 2010-08-25T16:31:16Z by zooko
Changed at 2010-08-25T16:31:33Z by zooko
Changed at 2010-08-25T16:31:45Z by zooko
Changed at 2010-08-25T16:31:54Z by zooko
Changed at 2010-08-25T16:32:05Z by zooko
Changed at 2010-08-25T16:32:15Z by zooko
comment:94 Changed at 2010-08-25T16:37:25Z by zooko
- Description modified (diff)
Added a new batch of runs -- runs zooko 4000 through 4006. There is a very clear pattern here! There only two server-selections represented: 1*fp3x,2*tavr and 2*fp3z,1*tavr. 1.8.0c2+combo.diff always chose the latter. v1.7.1 always chose the former except for one time when it chose the latter. Whenever you choose the latter you go at ~90 Kbps, whenever you choose the former you go at ~190 Kbps.
comment:95 Changed at 2010-08-25T17:55:36Z by terrell
- Description modified (diff)
fixed up the alternating line colorization - adding 3100-3109 in a minute...
Changed at 2010-08-25T18:03:39Z by terrell
Changed at 2010-08-25T18:03:52Z by terrell
Changed at 2010-08-25T18:04:06Z by terrell
Changed at 2010-08-25T18:04:25Z by terrell
Changed at 2010-08-25T18:04:38Z by terrell
Changed at 2010-08-25T18:04:49Z by terrell
comment:96 Changed at 2010-08-25T18:07:33Z by terrell
- Description modified (diff)
comment:97 Changed at 2010-08-25T18:29:39Z by warner
- Description modified (diff)
run 116 used 3*nszi
comment:98 Changed at 2010-08-25T19:46:49Z by terrell
- Description modified (diff)
Added rows for 3100-3109... will attach the curl output when I get back to that terminal window. All runs were ~90Kbps, and they all selected the same shares as Zooko's runs 4000-4006.
These were run with Brian's patch for 1.8.0c2+combo+viz vs. 1.7.1.
Changed at 2010-08-25T19:47:41Z by terrell
Changed at 2010-08-25T21:01:01Z by terrell
comment:99 Changed at 2010-08-26T04:58:57Z by zooko
I tested a well-distributed 25 MB file (http://pubgrid.tahoe-lafs.org/uri/URI:CHK:knvcmfkmzejsg2pfueygjpkygq:3qjcqnjzsccmwk5f4rtsbusln66mgel6esiclahz7hbcsqgqf3ga:3:10:24879985?t=info) and 1.8.0c2+1170-combo.diff was much better than v1.7.1 every time. I don't have the energy to edit all of this into the table, upload all the data files, hyperlink to them, etc., so here is a big ugly dump of the information. Sorry. Goodnight!
  % Total    % Received % Xferd  Average Speed   Time    Time     Time  Current
                                 Dload  Upload   Total   Spent    Left  Speed
/Users/zooko/playground/tahoe-lafs/1.7.1
100 23.7M  100 23.7M    0     0  71475      0  0:05:48  0:05:48 --:--:--  105k
/Users/zooko/playground/tahoe-lafs/trunk
100 23.7M  100 23.7M    0     0   274k      0  0:01:28  0:01:28 --:--:--  324k
--
/Users/zooko/playground/tahoe-lafs/1.7.1
100 23.7M  100 23.7M    0     0  72096      0  0:05:45  0:05:45 --:--:-- 85335
/Users/zooko/playground/tahoe-lafs/trunk
100 23.7M  100 23.7M    0     0   247k      0  0:01:38  0:01:38 --:--:--  160k
--
/Users/zooko/playground/tahoe-lafs/1.7.1
100 23.7M  100 23.7M    0     0  70986      0  0:05:50  0:05:50 --:--:-- 75037
/Users/zooko/playground/tahoe-lafs/trunk
100 23.7M  100 23.7M    0     0   282k      0  0:01:26  0:01:26 --:--:--  311k
--
/Users/zooko/playground/tahoe-lafs/1.7.1
100 23.7M  100 23.7M    0     0  71613      0  0:05:47  0:05:47 --:--:--  106k
/Users/zooko/playground/tahoe-lafs/trunk
100 23.7M  100 23.7M    0     0   283k      0  0:01:25  0:01:25 --:--:--  325k
--
/Users/zooko/playground/tahoe-lafs/1.7.1
100 23.7M  100 23.7M    0     0  72017      0  0:05:45  0:05:45 --:--:-- 96431
/Users/zooko/playground/tahoe-lafs/trunk
100 23.7M  100 23.7M    0     0   275k      0  0:01:28  0:01:28 --:--:--  320k
--
/Users/zooko/playground/tahoe-lafs/1.7.1
100 23.7M  100 23.7M    0     0  72835      0  0:05:41  0:05:41 --:--:-- 90257
/Users/zooko/playground/tahoe-lafs/trunk
100 23.7M  100 23.7M    0     0   279k      0  0:01:26  0:01:26 --:--:--  291k
--
/Users/zooko/playground/tahoe-lafs/1.7.1
100 23.7M  100 23.7M    0     0  72809      0  0:05:41  0:05:41 --:--:--  105k
/Users/zooko/playground/tahoe-lafs/trunk
100 23.7M  100 23.7M    0     0   288k      0  0:01:24  0:01:24 --:--:--  309k
--
/Users/zooko/playground/tahoe-lafs/1.7.1
100 23.7M  100 23.7M    0     0  71796      0  0:05:46  0:05:46 --:--:-- 94458
/Users/zooko/playground/tahoe-lafs/trunk
100 23.7M  100 23.7M    0     0   156k      0  0:02:34  0:02:34 --:--:--  290k
--
/Users/zooko/playground/tahoe-lafs/1.7.1
100 23.7M  100 23.7M    0     0  71478      0  0:05:48  0:05:48 --:--:-- 90567
/Users/zooko/playground/tahoe-lafs/trunk
100 23.7M  100 23.7M    0     0   282k      0  0:01:26  0:01:26 --:--:--  322k
--
/Users/zooko/playground/tahoe-lafs/1.7.1
100 23.7M  100 23.7M    0     0  70879      0  0:05:51  0:05:51 --:--:-- 95211
/Users/zooko/playground/tahoe-lafs/trunk
100 23.7M  100 23.7M    0     0   278k      0  0:01:27  0:01:27 --:--:--  326k
--
/Users/zooko/playground/tahoe-lafs/1.7.1
100 23.7M  100 23.7M    0     0  72039      0  0:05:45  0:05:45 --:--:--  101k
/Users/zooko/playground/tahoe-lafs/trunk
100 23.7M  100 23.7M    0     0   278k      0  0:01:27  0:01:27 --:--:--  309k
--
/Users/zooko/playground/tahoe-lafs/1.7.1
100 23.7M  100 23.7M    0     0  71756      0  0:05:46  0:05:46 --:--:--  102k
/Users/zooko/playground/tahoe-lafs/trunk
100 23.7M  100 23.7M    0     0   269k      0  0:01:30  0:01:30 --:--:--  310k
--
/Users/zooko/playground/tahoe-lafs/1.7.1
100 23.7M  100 23.7M    0     0  64652      0  0:06:24  0:06:24 --:--:-- 87644
/Users/zooko/playground/tahoe-lafs/trunk
100 23.7M  100 23.7M    0     0   279k      0  0:01:26  0:01:26 --:--:--  310k
--
/Users/zooko/playground/tahoe-lafs/1.7.1
100 23.7M  100 23.7M    0     0  71130      0  0:05:49  0:05:49 --:--:--  103k
/Users/zooko/playground/tahoe-lafs/trunk
100 23.7M  100 23.7M    0     0   257k      0  0:01:34  0:01:34 --:--:--  313k
--
/Users/zooko/playground/tahoe-lafs/1.7.1
100 23.7M  100 23.7M    0     0  71088      0  0:05:49  0:05:49 --:--:-- 62766
/Users/zooko/playground/tahoe-lafs/trunk
100 23.7M  100 23.7M    0     0   280k      0  0:01:26  0:01:26 --:--:--  332k
--
/Users/zooko/playground/tahoe-lafs/1.7.1
100 23.7M  100 23.7M    0     0  71712      0  0:05:46  0:05:46 --:--:-- 81047
/Users/zooko/playground/tahoe-lafs/trunk
100 23.7M  100 23.7M    0     0   277k      0  0:01:27  0:01:27 --:--:--  330k
--
/Users/zooko/playground/tahoe-lafs/1.7.1
100 23.7M  100 23.7M    0     0  72124      0  0:05:44  0:05:44 --:--:-- 90323
/Users/zooko/playground/tahoe-lafs/trunk
100 23.7M  100 23.7M    0     0   286k      0  0:01:24  0:01:24 --:--:--  312k
--
/Users/zooko/playground/tahoe-lafs/1.7.1
100 23.7M  100 23.7M    0     0  71579      0  0:05:47  0:05:47 --:--:--  106k
/Users/zooko/playground/tahoe-lafs/trunk
100 23.7M  100 23.7M    0     0   287k      0  0:01:24  0:01:24 --:--:--  325k
--
/Users/zooko/playground/tahoe-lafs/1.7.1
100 23.7M  100 23.7M    0     0  72847      0  0:05:41  0:05:41 --:--:--  104k
/Users/zooko/playground/tahoe-lafs/trunk
100 23.7M  100 23.7M    0     0   266k      0  0:01:31  0:01:31 --:--:--  277k
--
/Users/zooko/playground/tahoe-lafs/1.7.1
100 23.7M  100 23.7M    0     0  48285      0  0:08:35  0:08:35 --:--:-- 85752
/Users/zooko/playground/tahoe-lafs/trunk
100 23.7M  100 23.7M    0     0   266k      0  0:01:31  0:01:31 --:--:--  283k
comment:100 Changed at 2010-08-27T00:31:42Z by davidsarah
#1187 describes an approach that could mitigate the effect of choosing some slow servers. (I think that is complementary to trying to make better server choices.)
comment:101 Changed at 2010-08-29T22:56:49Z by zooko
Brian and David-Sarah and I have discussed this off and on over the last few days, mostly on IRC, and we agree that the way forward to 1.8.0 final is to review and commit to trunk attachment:viz-with-combo.diff.bz2, then make a 1.8.0c3 release and invite everyone to test out the new, even better downloader and the new visualizations.
Changed at 2010-08-31T19:55:52Z by warner
for review: drop received data after each block finishes, to avoid spans.py complexity bug
Changed at 2010-08-31T19:56:34Z by warner
for review: use diversity-seeking share-selection algorithm, improve logging
Changed at 2010-08-31T19:57:07Z by warner
for review: add Protovis-based download-status timeline visualization page
comment:102 Changed at 2010-08-31T19:59:23Z by warner
ok, those three patches are ready for review, and are meant to be applied to current trunk in that order.
If you want me to land these, please let me know by say thursday, since I'm travelling this weekend and will have only limited network access next week.
comment:103 Changed at 2010-08-31T23:46:23Z by zooko
I would rather apply them to trunk myself after reviewing them.
comment:104 Changed at 2010-08-31T23:54:19Z by zooko
By the way, if you are already on your travels by the time I review these patches then if there is any very small, obvious fix that is needed I might do it myself rather than wait for you to get back on-line. Hopefully none will be needed and I can apply these as-is for 1.8.0c3. One thing that I'm suspecting I'm going to want changed is the visualization -- last time I looked it lacked labels indicating the meanings of the axes, the units, and the meanings of the objects, and I really hate graphs without complete labels. I think maybe it is something that my high school chemistry teacher crammed into my head? Never never never report data without units and labels.
comment:105 Changed at 2010-09-01T00:14:13Z by zooko
Doesn't 1170-p3.diff mean we need to update docs/frontends/download-status.txt?
comment:106 Changed at 2010-09-01T00:27:07Z by zooko
Ugh, 1170-p3.diff adds in jquery.js, 120 KB and more than 4000 lines of code, and protovis-r3.2.js, 116 KB and a minified (therefore obscured) version of more than 15,000 lines of code. This means we are storing 3rd party source code in our revision control history, and in the case of protovis-r3.2.js it isn't even the real source code, but a minified (compressed) version of it. If only there were a principled, manageable way to declare our dependencies on those JavaScript codebases! :-(
But I'm not aware of one that we can use. At least let us not store computer-produced stuff -- the minified version of protovis -- but instead store the original "preferred form for making modifications" and minify it as a part of the build process or as part of the start up of the web gateway.
Does anyone know of a better way to manage our dependencies on JavaScript code?
comment:107 Changed at 2010-09-01T00:34:27Z by warner
yeah, that's tricky. I'm not sure what to suggest. For reference, the non-minified protovis code (protovis-d3.2.js) is 510KB (versus the minified protovis-r3.2.js is 117KB). The minified jquery.js would be 57KB, versus the non-minified at 121KB.
Changed at 2010-09-01T04:16:25Z by warner
patchbundle with all three patches, ready to land upon passing review
comment:108 Changed at 2010-09-02T05:11:09Z by zooko
I reviewed the first one and applied it as c89a464510394089. Thanks! Now trunk no longer has a superlinear CPU usage when uploading large files!
comment:109 Changed at 2010-09-02T05:47:40Z by zooko
I reviewed the second one and applied it as 00e9e4e6760021a1. Whoo-hoo! Now trunk has all of the Brian's New Downloader patches which Terrell and I benchmarked as being way better than the old 1.7.1 downloader!
Everyone should test and benchmark the heck out of trunk! This might become 1.8.0c3, or else we might figure out how to package up the third of Brian's three patches, the one that gives the beautiful JavaScript download visualization. However, I'm not sure if I want to put that in to 1.8.0c3, mostly because of JavaScript packaging issues. Either way, you should test the heck out of the current trunk. :-)
comment:110 Changed at 2010-09-07T03:21:13Z by zooko
See Kyle's latest benchmarking reports:
- http://tahoe-lafs.org/pipermail/tahoe-dev/2010-September/005148.html
- http://tahoe-lafs.org/pipermail/tahoe-dev/2010-September/005149.html
- http://tahoe-lafs.org/pipermail/tahoe-dev/2010-September/005155.html
short version: unless Kyle's measurements are wrong, there is still a huge performance regression which blocks 1.8.0 release. Waaah! :-(
comment:111 Changed at 2010-09-07T03:35:20Z by zooko
I ran a large download under cProfile and the results clearly show that there is no CPU hotspot. Filtering out all the rows that had less than 10 seconds total CPU time during the 6 hours that I left it running (about 2.5 of which it was doing a download), and I get:
         276522586 function calls (275942089 primitive calls) in 26729.374 CPU seconds

   Ordered by: standard name

   ncalls  tottime  percall  cumtime  percall filename:lineno(function)
 16637385   12.999    0.000   12.999    0.000 <string>:1(fileno)
  2896395   13.714    0.000   26.006    0.000 abstract.py:177(write)
    78933   10.012    0.000   56.906    0.001 banana.py:701(handleData)
5897783/5897092   12.339    0.000   84.484    0.000 flatstan.py:30(TagSerializer)
   871861   11.661    0.000  311.571    0.000 log.py:71(callWithLogger)
   959692   22.170    0.000 26474.218    0.028 selectreactor.py:93(doSelect)
   849079   12.753    0.000   19.519    0.000 stan.py:40(__getitem__)
   824202   11.533    0.000  141.241    0.000 tcp.py:114(doRead)
   824378   13.608    0.000  229.558    0.000 tcp.py:443(doRead)
   148/44   10.610    0.072   99.162    2.254 ten.py:73(iterflatten)
   824202   57.850    0.000   57.851    0.000 {built-in method recv}
 17685095   11.745    0.000   11.745    0.000 {isinstance}
     8554   10.254    0.001   10.254    0.001 {method 'process' of '_aes.AES' objects}
   172850   22.907    0.000   22.907    0.000 {method 'update' of '_sha256.SHA256' objects}
  2399813   10.269    0.000   10.269    0.000 {min}
   959692 26125.485    0.027 26137.268    0.027 {select.select}
comment:112 Changed at 2010-09-07T04:55:12Z by zooko
I am now going to attach the status.html files from the download that was run under the profiler and whose profiling results were posted in comment:111. Why this single download (with Firefox 4 beta) of a single file spawned 8 download status pages I don't know.
comment:113 Changed at 2010-09-10T19:24:23Z by zooko
- Resolution set to fixed
- Status changed from new to closed
Recap of this ticket: there were two major performance regressions in 1.8.0c1 or c2 vs. 1.7.1. One was the superlinear computation in spans and the other was a server-selection algorithm that would in some cases choose to get multiple shares from one server unnecessarily. Both of those are fixed in 1.8.0c4 (upcoming) and benchmarks by various people indicate that 1.8.0c4 immutable download is only a little slower (~10% slower) than 1.7.1 in the worst case and much faster (e.g. ~400% faster) in other common cases.
So, this ticket is done well enough for v1.8.0 final. I strongly suspect that the remaining ~10% slowdown has to do with more computation after receiving a block and before sending the next get_block request, which would probably be best addressed by implementing #1110 or #1187.
Thanks very much to Brian, Terrell, David-Sarah, Kyle, and anyone else who helped slay this damned tenacious issue. :-) Hooray! It is dead! Good-bye ticket #1170!
P.S. The gentle reader, before looking away from this ticket forever and ever, might want to look at the following comments and perhaps transcribe some of their important bits out to a fresh new ticket: comment:43, comment:90, comment:92. And by "the gentle reader", I guess I mean Brian.
comment:114 Changed at 2010-09-18T18:08:09Z by zooko
The part of this ticket that was about integrating, deploying, and supporting the new visualizer has been moved to #1200 (package up Brian's New Visualization of immutable download).
comment:115 Changed at 2010-11-19T02:17:35Z by davidsarah
See also #1182 (clean up and improve asymptotic complexity of Spans and DataSpans?).
comment:116 Changed at 2010-11-23T23:38:50Z by warner
#1268 has been opened to cover the "coalesce Share.loop() calls" fix mentioned in comment:92. I think that's all the action items leftover from this ticket.
Oh, all those 32-byte reads must have been all the hashes in the Merkle Trees. I assume that those are indeed coalesced using the clever spans structure src/allmydata/util/spans.py@4666. Nevertheless we should investigate the very poor performance shown in this download status file.